Stop Drawing Lines.
Start Trading Breaks.
A complete trend line system that finds the levels, detects the breaks, and scans your entire watchlist — so you spend less time drawing and more time trading.
30-Day Money-Back Guarantee
Try it risk-free. Not satisfied? Full refund, no questions asked.
Drawing Trend Lines by Hand Is Costing You Trades
You spend 30+ minutes every morning redrawing lines across your charts
By the time your analysis is done, the first breakout of the session already happened.
Your lines are subjective — different every time you draw them
Two traders looking at the same chart draw completely different levels. Which one is right?
You can only monitor 3-4 charts at once
While you're watching SPY, the breakout is happening on AAPL. You don't find out until after the move.
You see the break but don't know if it's real or a fake-out
No volume data, no range data, no objective filter. Just gut feel — and gut feel doesn't scale.
The problem isn't your skill as a trader. The problem is that manual trend line analysis doesn't scale. You need a system that does the drawing, the scanning, and the confirming — so you can focus on what actually matters: taking the trade.
4 Studies. One Complete System.
Each study handles a different part of your workflow — from identifying levels to scanning for breaks to confirming with data. Together, they replace your entire manual trend line process.
See Every Trend Line — Without Drawing a Single One
Automatically identifies pivot highs and lows, then connects them with color-coded trend lines. Yellow for resistance, cyan for support. Updates in real time as new pivots form. Configurable sensitivity — from tight intraday levels to major swing structure.
Full details & install guide →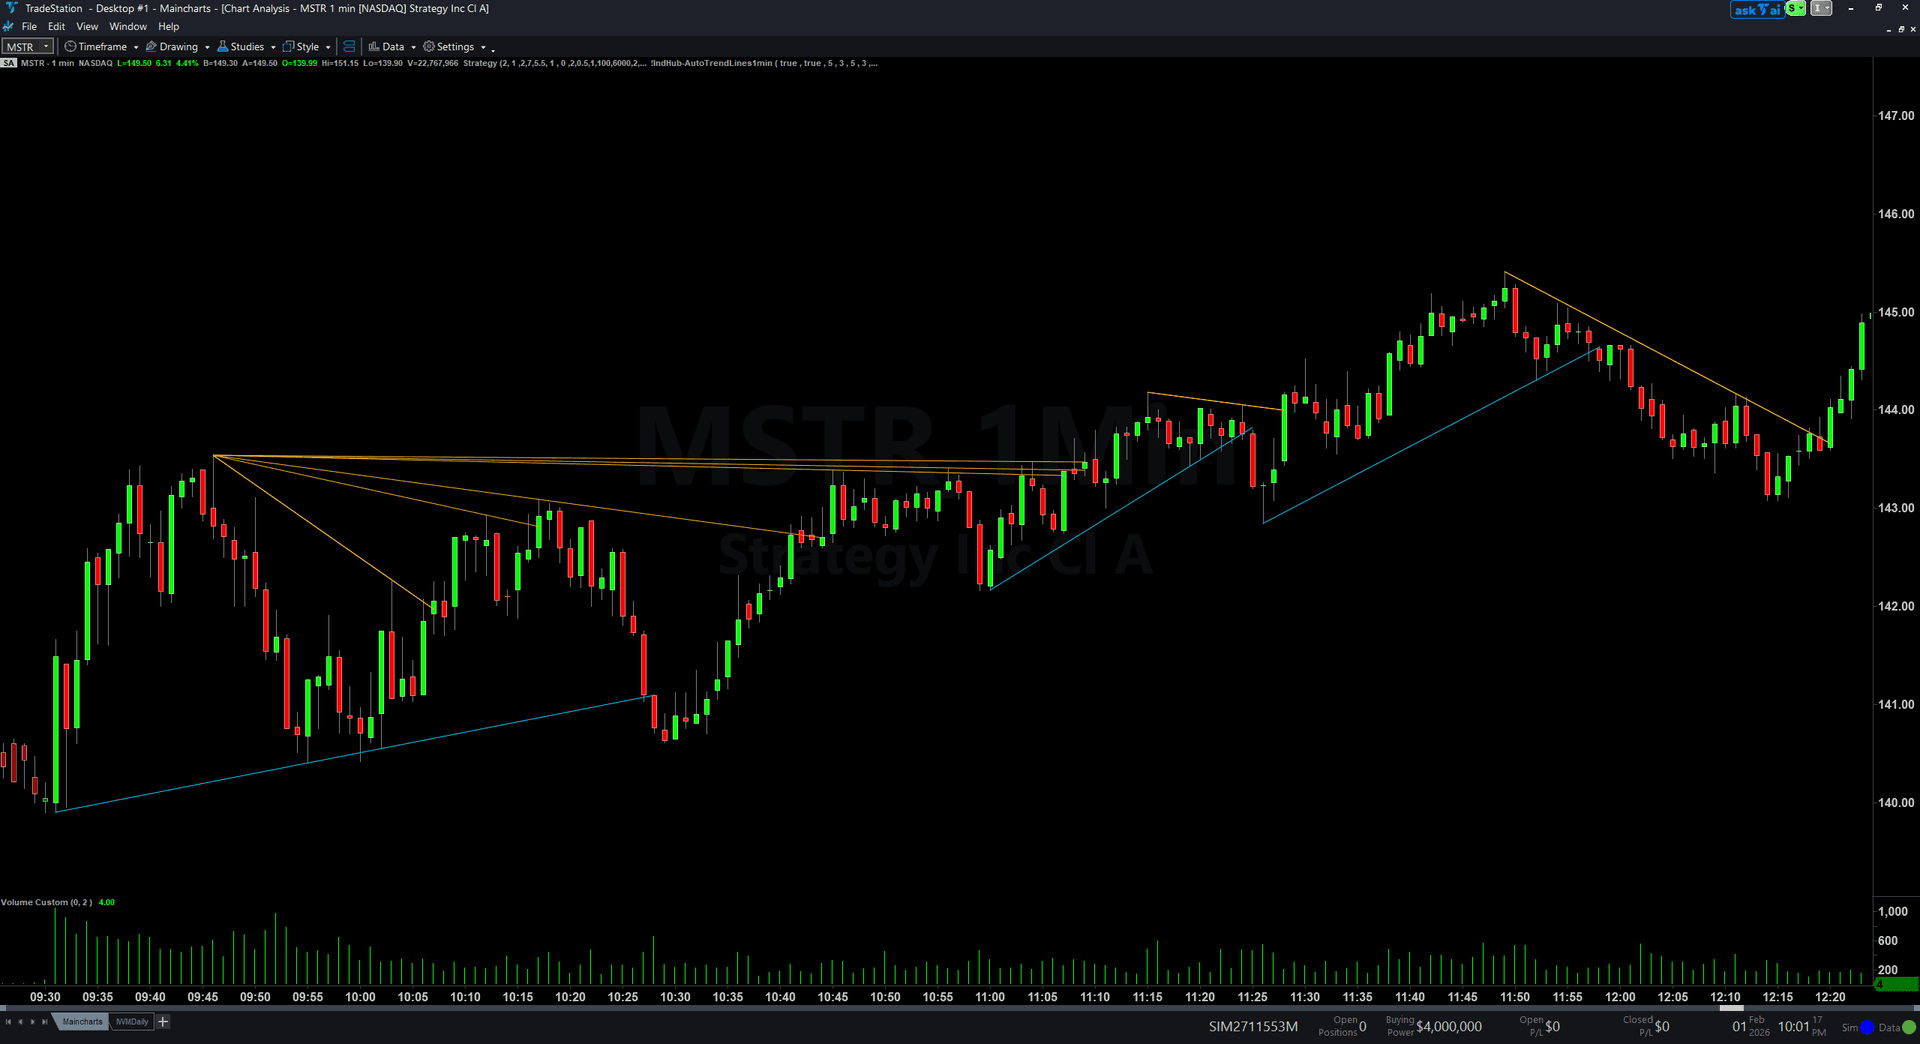
Scan 40+ Symbols for Breaks — Without Opening a Chart
Monitors your entire watchlist for trend line breaks in real time. Sortable columns show break direction, trend values, and exact timestamps. Sort by break time to catch signals as they fire. Yellow cells = breaking right now.
Full details & install guide →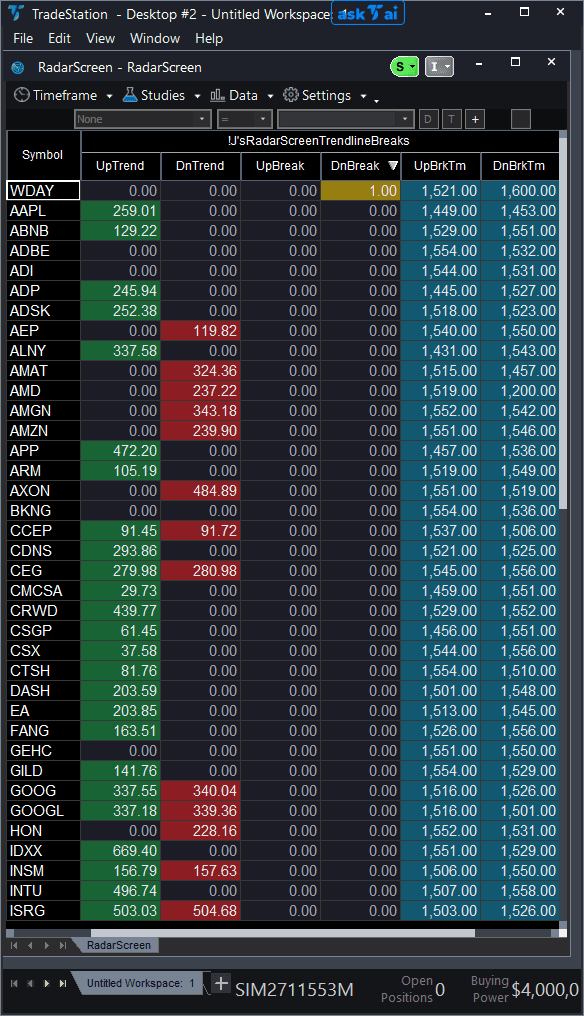
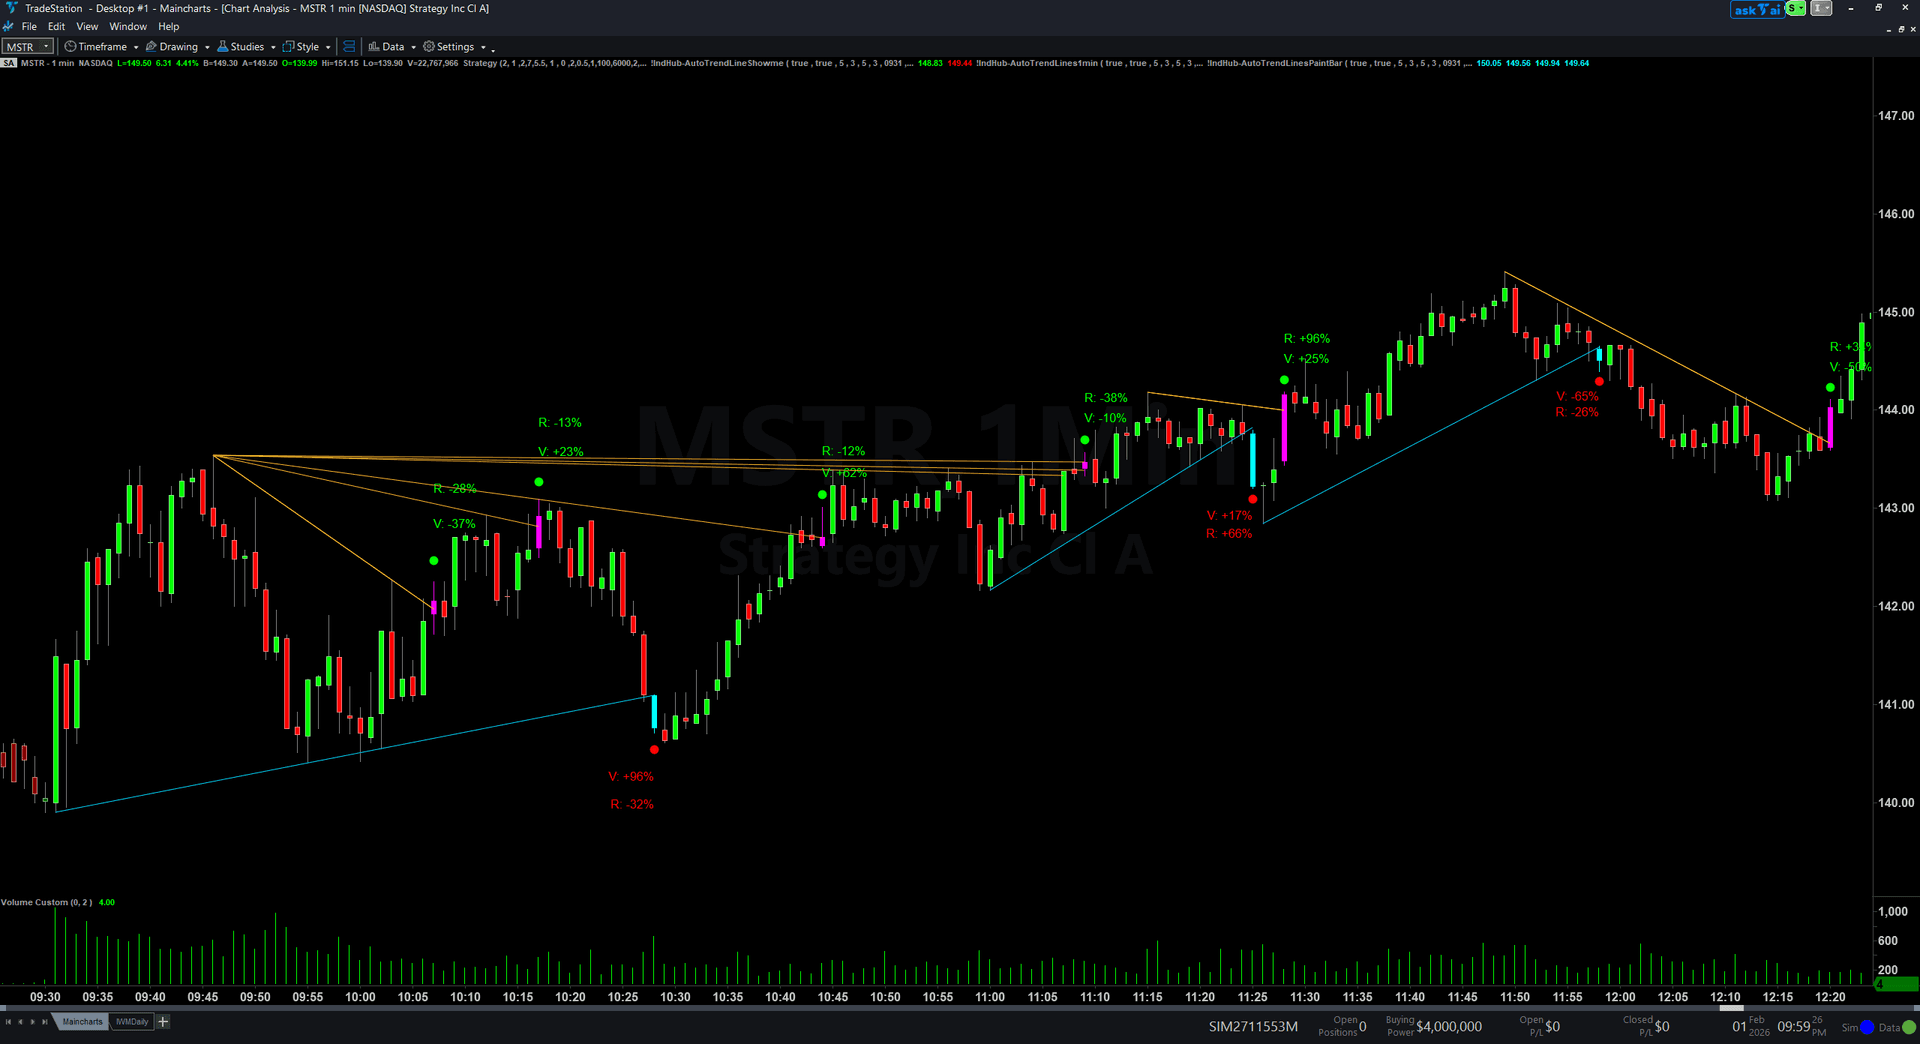
Know If the Break Is Real — Before You Enter
Marks exact break bars with colored dots plus volume and range data. Green dots for bullish breaks, red for bearish. Volume percentage tells you if institutions participated. Range percentage tells you if the move has momentum. High-volume + wide-range = real break.
Full details & install guide →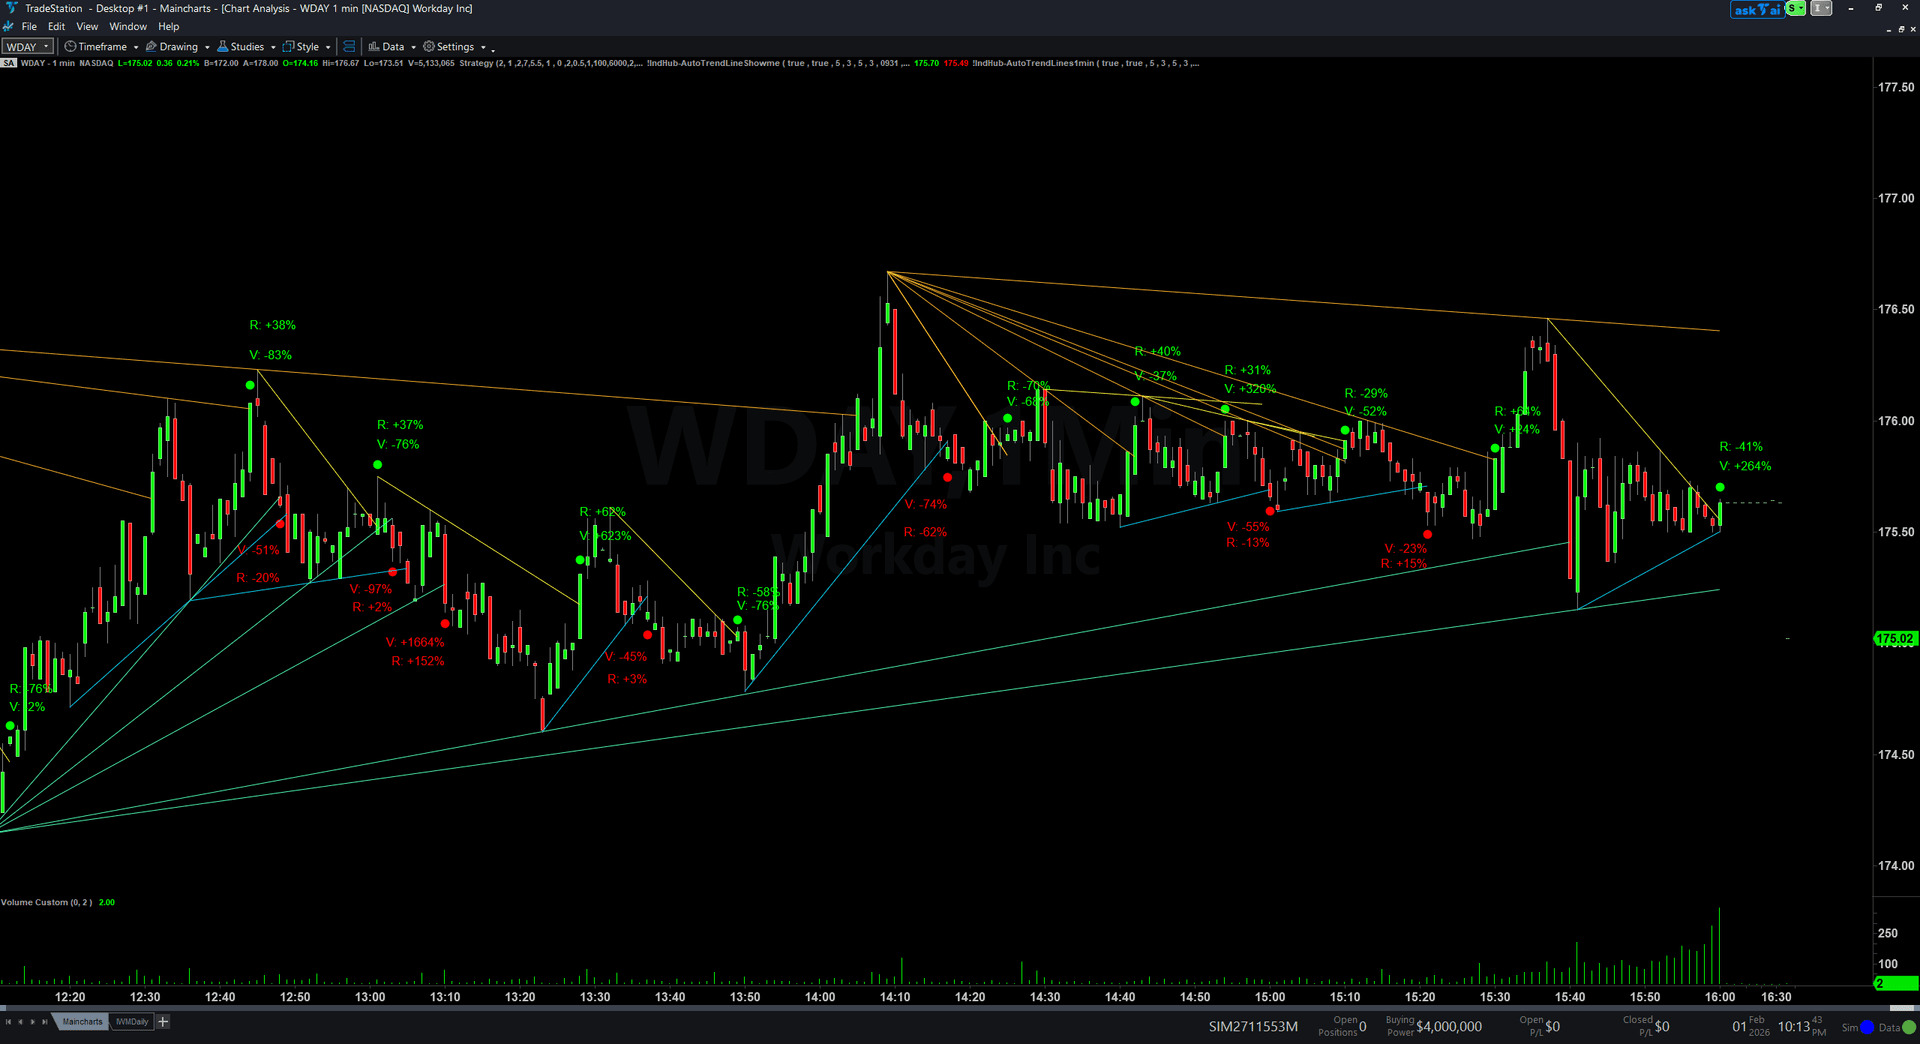
Spot Break Bars Instantly — Even in Peripheral Vision
Colors the exact bars where trend line breaks occur. Magenta for bullish breaks, cyan for bearish. Impossible to miss even on busy charts or when watching multiple windows. The fastest visual confirmation layer you can add.
Full details & install guide →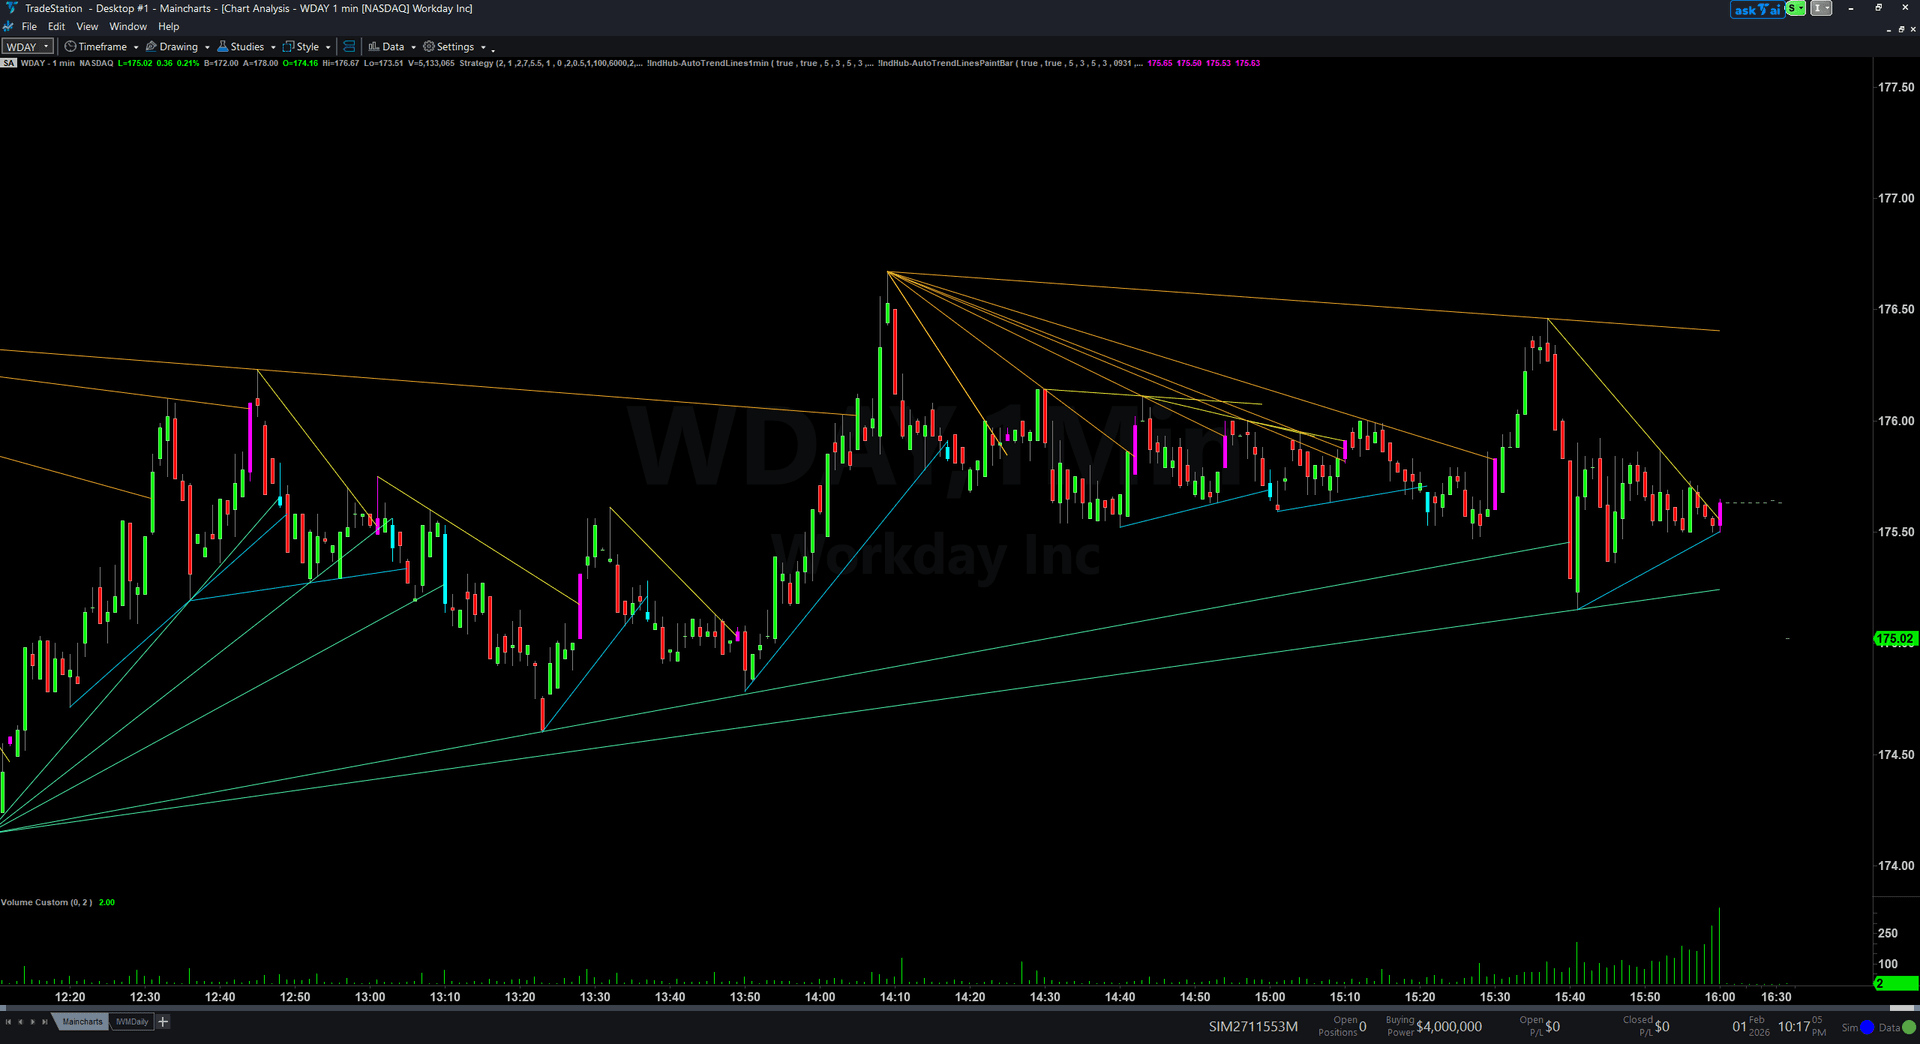
See It in Action
Watch the full system working live — from auto-drawn lines to break detection to watchlist scanning.
Your Trading Session, Transformed
Open your charts. Lines are already drawn.
The chart indicator identifies pivot highs and lows automatically and connects them with color-coded trend lines. No setup needed — just apply the study and go.
Scan your watchlist for breaks. All at once.
The RadarScreen scanner monitors 40+ symbols simultaneously. Sort by break time to see which ones are breaking right now. No more flipping through charts.
Confirm the break is real. With data, not gut feel.
The ShowMe study tells you the volume and range of every break bar. High volume + wide range = institutional participation. Low volume = likely fake-out. Now you know before you enter.
Take the trade. Painted bars make signals unmissable.
The PaintBar colors break bars in standout magenta or cyan. Even if you're watching 4 charts at once, you'll catch the signal. No more "I saw it too late."
100% Non-Repainting. By Design.
All break signals use completed bar data only. Once a trend line break is confirmed and plotted on a closed bar, it will never disappear, move, or change — no matter what price does next. This isn't a setting you toggle. It's how the math works.
Is This System Right for You?
This is for you if:
- You trade breakouts and breakdowns but waste time drawing lines manually
- You manage a watchlist of 20+ symbols and can't monitor them all
- You want objective, data-backed confirmation at break points
- You use TradeStation or TradingView and want a dedicated trend line workflow
- You trade stocks, futures, or ETFs on intraday to daily timeframes
This is NOT for you if:
- You don't use TradeStation or TradingView
- You prefer fundamental analysis and don't use chart patterns
- You want a fully automated trading bot that places orders for you
- You want a fully automated scanner that replaces chart analysis entirely
Common Questions
The trend lines look cluttered with too many lines on my chart. How do I clean it up?
The indicator looks best on 1-minute charts but lines look odd on daily charts. Is this normal?
Can I show only support lines or only resistance lines?
What does the EMA filter do?
How do I install the TradingView/PineScript version?
Does the TradingView version include RadarScreen scanning?
Can I use the TradingView version on crypto and forex?
All columns show zeros for every symbol. Nothing is loading.
The UpBreak or DnBreak column flashes a signal but when I open the chart I do not see the break.
Can I use this to scan for breaks on daily charts?
The volume and range text is not showing on my chart, only the dots appear.
Some break dots show negative volume percentages. What does that mean?
Can I use the ShowMe without the main chart indicator?
I do not see any colored bars on my chart. The indicator is applied but nothing is painted.
Can I change the break colors to something other than magenta and cyan?
Available on Both Platforms
Same powerful trendline engine. Choose the version that matches your trading platform.
EasyLanguage Bundle
- ✓4 dedicated ELD indicator files
- ✓Chart Indicator with auto-drawn trendlines
- ✓RadarScreen scanner for 40+ symbols
- ✓ShowMe study with volume/range data
- ✓PaintBar study for break bar coloring
Pine Script v6
- ✓1 unified indicator with all modules
- ✓PaintBar, ShowMe arrows, and Data Panel built in
- ✓Toggle each module on/off independently
- ✓Works on any TradingView market (crypto, forex, stocks, futures)
- ✓Copy-paste installation — no file imports needed
Your Trend Lines, Drawn Automatically.
Your Breaks, Detected Instantly.
Available on TradeStation and TradingView. Every trend line break across your entire watchlist — caught, confirmed, and colored. No more manual drawing. No more missed breakouts.
30-Day Money-Back Guarantee
Try it risk-free. Not satisfied? Full refund, no questions asked.
One-time purchase per platform. Instant download. Non-repainting guaranteed.