Auto Trend Lines PaintBar
Auto Trend Lines PaintBar adds an unmissable visual layer to your trend line analysis by coloring the exact bars where price breaks through key trend lines. Magenta bars signal bullish breaks (price breaking above a resistance trend line). Cyan bars signal bearish breaks (price breaking below a support trend line). Uncolored bars retain their normal candlestick colors, making break bars stand out immediately even at a glance.
- ●Magenta-colored bars appear when price breaks above a downtrend resistance line — potential long signal
- ●Cyan-colored bars appear when price breaks below an uptrend support line — potential short signal
- ●BullBreakColor and BearBreakColor inputs let you customize the highlight colors to match your chart theme
- ●Works alongside the chart indicator and ShowMe study — the trend lines show levels, the PaintBar highlights breaks, and the ShowMe adds volume and range data
The PaintBar is the fastest way to spot break signals on a busy chart. When you see a magenta or cyan bar, you know immediately that a trend line break just occurred without needing to read any numbers or check any subgraph. This makes it especially valuable during fast market conditions when speed matters.
All break signals are guaranteed non-repainting. Once a bar is colored on close, the color will never change.
30-Day Money-Back Guarantee
Try it risk-free. Not satisfied? Full refund, no questions asked.
Part of the Auto Trend Lines System
Get all 4 study types for $65 — save $30
Who This Is For
Auto Trend Lines PaintBar is designed as a visual confirmation layer that works on top of the chart indicator and ShowMe study. Use it when you want the fastest possible recognition of break signals — colored bars are impossible to miss even when scrolling quickly through charts or watching multiple windows.
Apply it to the same chart as the Auto Trend Lines chart indicator. The trend lines show you where key levels are, and the painted bars show you exactly which bar broke through. Add the ShowMe study for volume and range data at each break point for the complete three-layer system.
Particularly effective on 1-minute to 5-minute charts during active trading sessions when you need split-second awareness of break signals across multiple chart windows. The color contrast between magenta/cyan break bars and normal candlestick colors makes signals visible even in your peripheral vision.
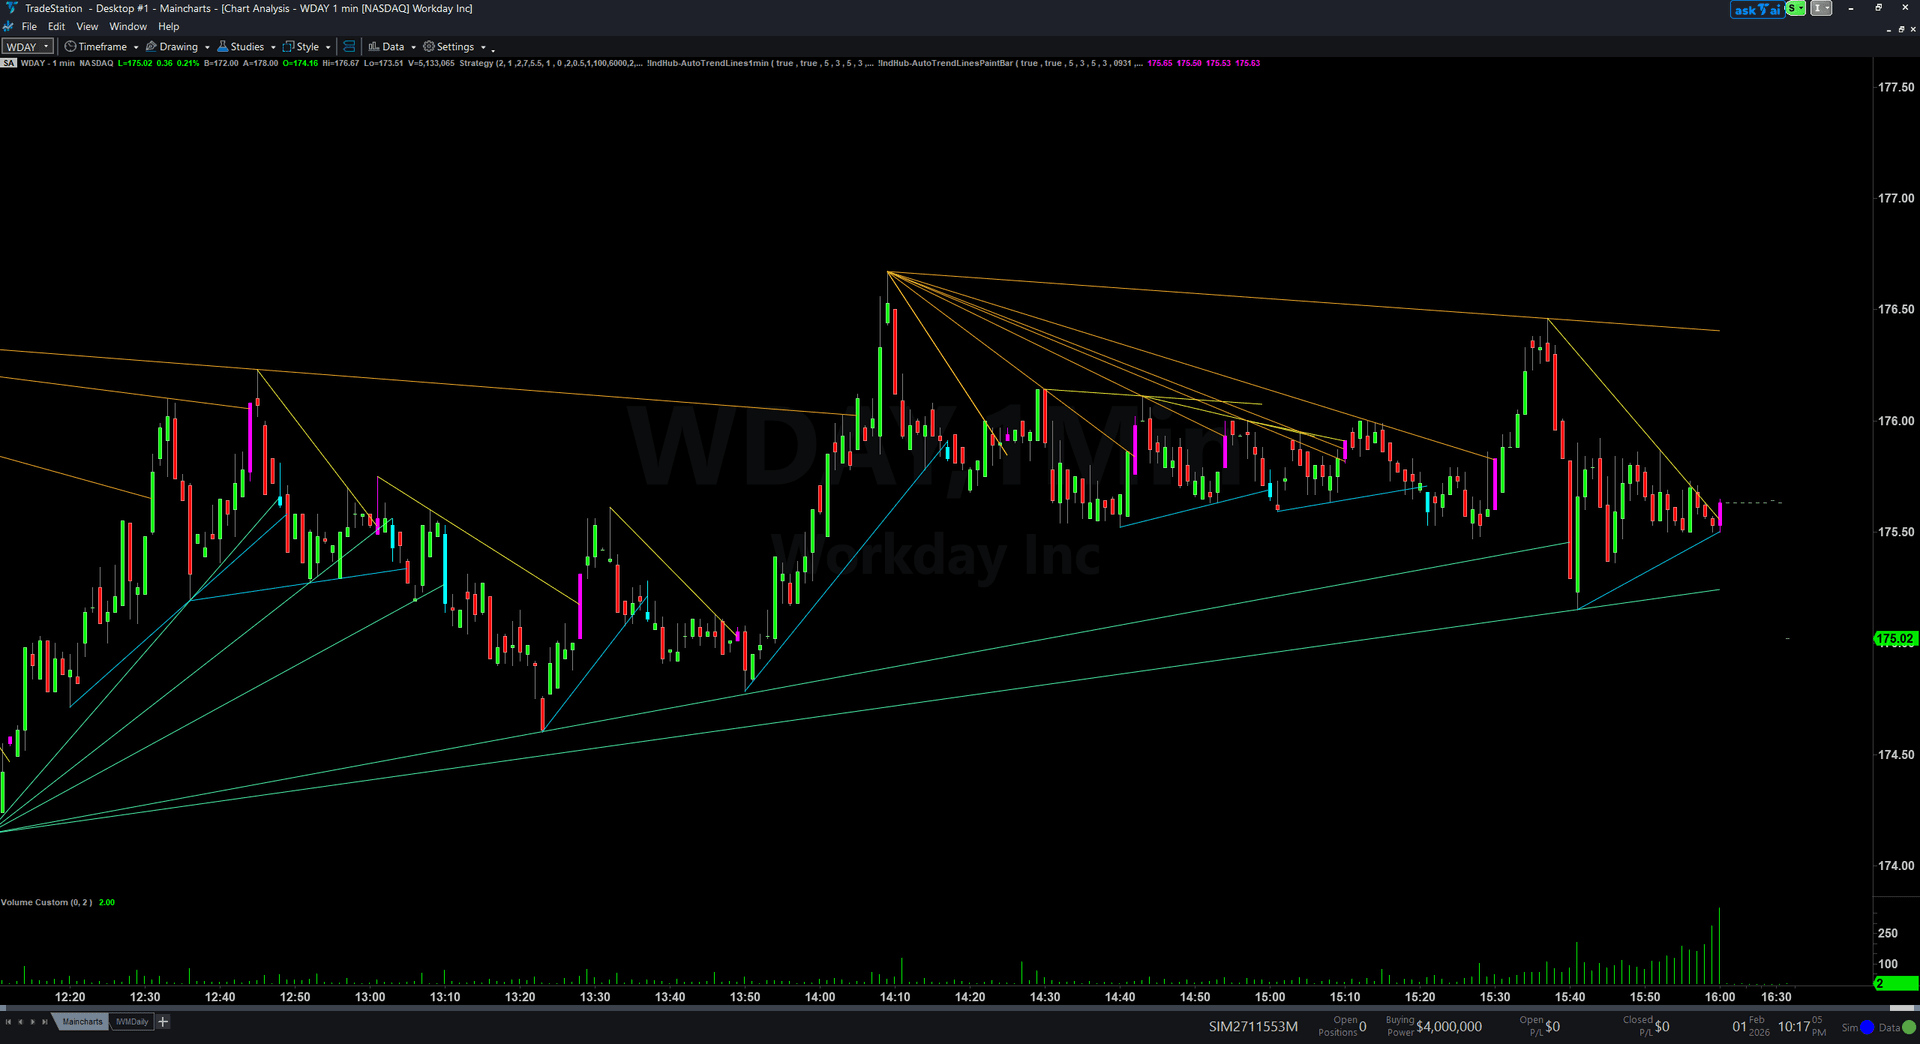
See It in Action
Example chart showing Auto Trend Lines PaintBar on a live trading session
Installation Guide
Step 1: Download the indicator file
After purchasing, you will receive a download link via email. Click the link and save the auto-trend-lines-paintbar.eld file to your computer. Save it somewhere easy to find like your Desktop or Downloads folder.
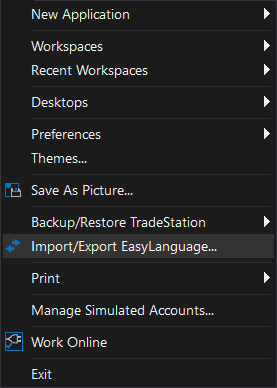
Step 2: Open the Import Wizard
Open TradeStation. Click the File menu in the top-left corner, then select Import/Export EasyLanguage to launch the Import/Export Wizard.
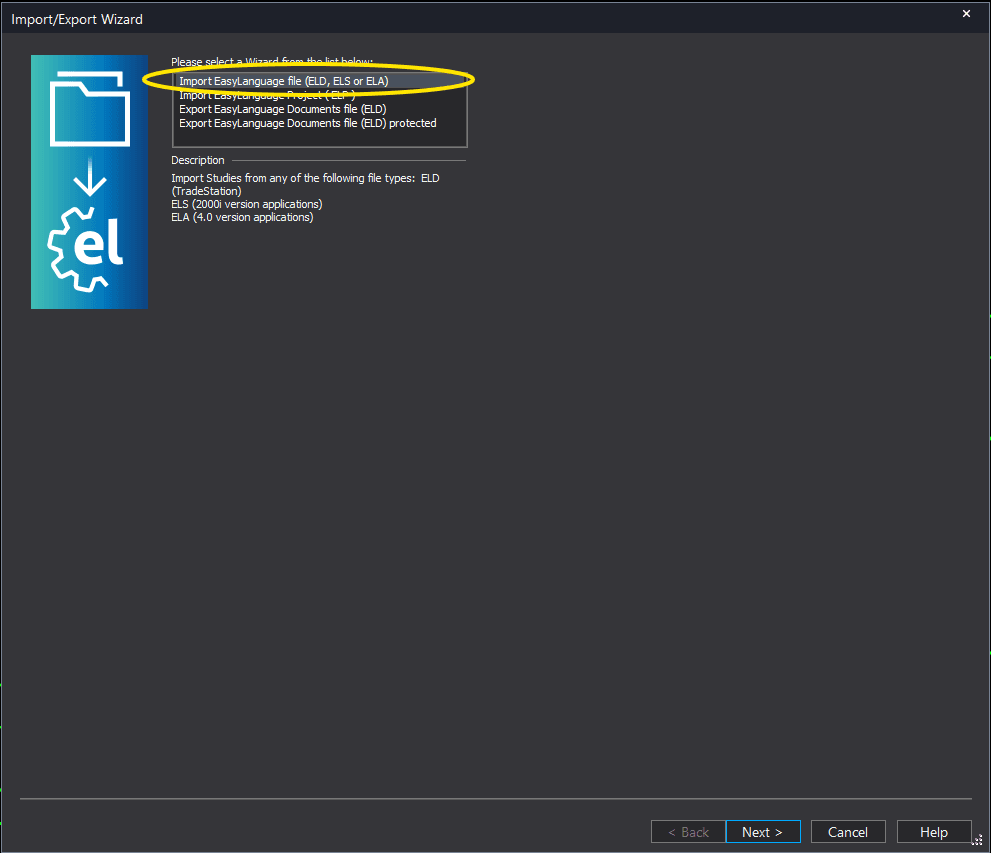
Step 3: Select the import type
In the Import/Export Wizard, select "Import EasyLanguage file (ELD, ELS or ELA)" from the list. Click Next to continue.
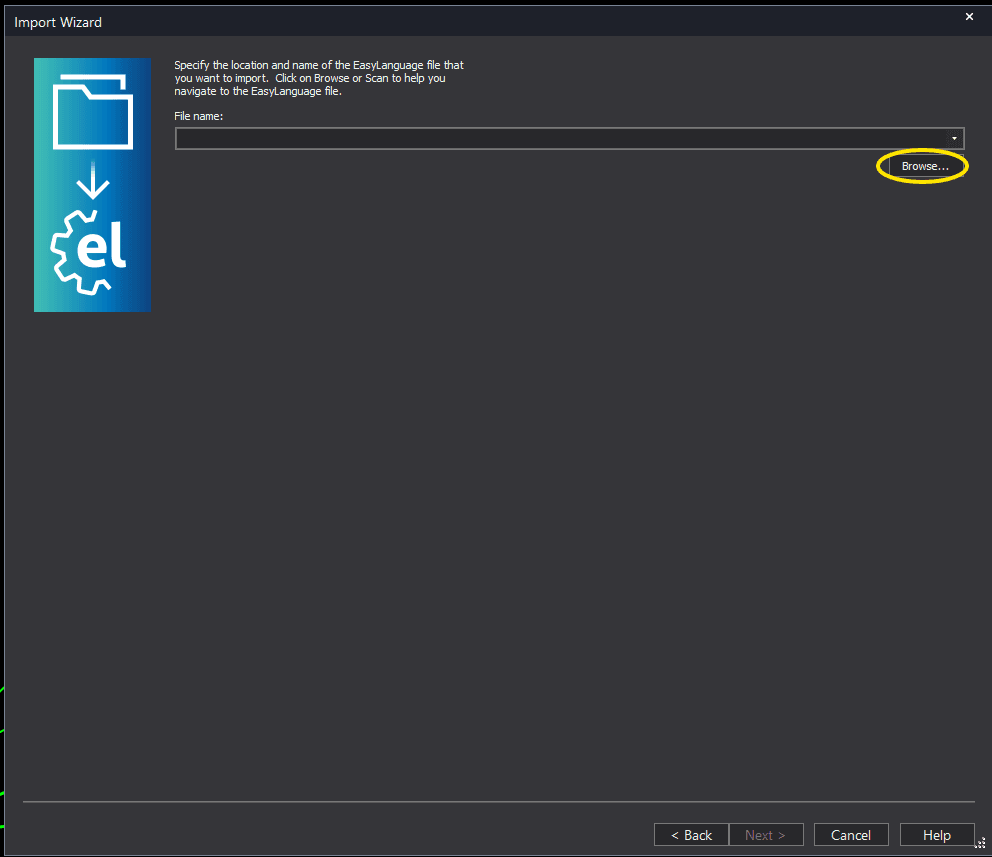
Step 4: Browse for the file
Click the Browse button to open a file browser where you can locate your downloaded .ELD file.
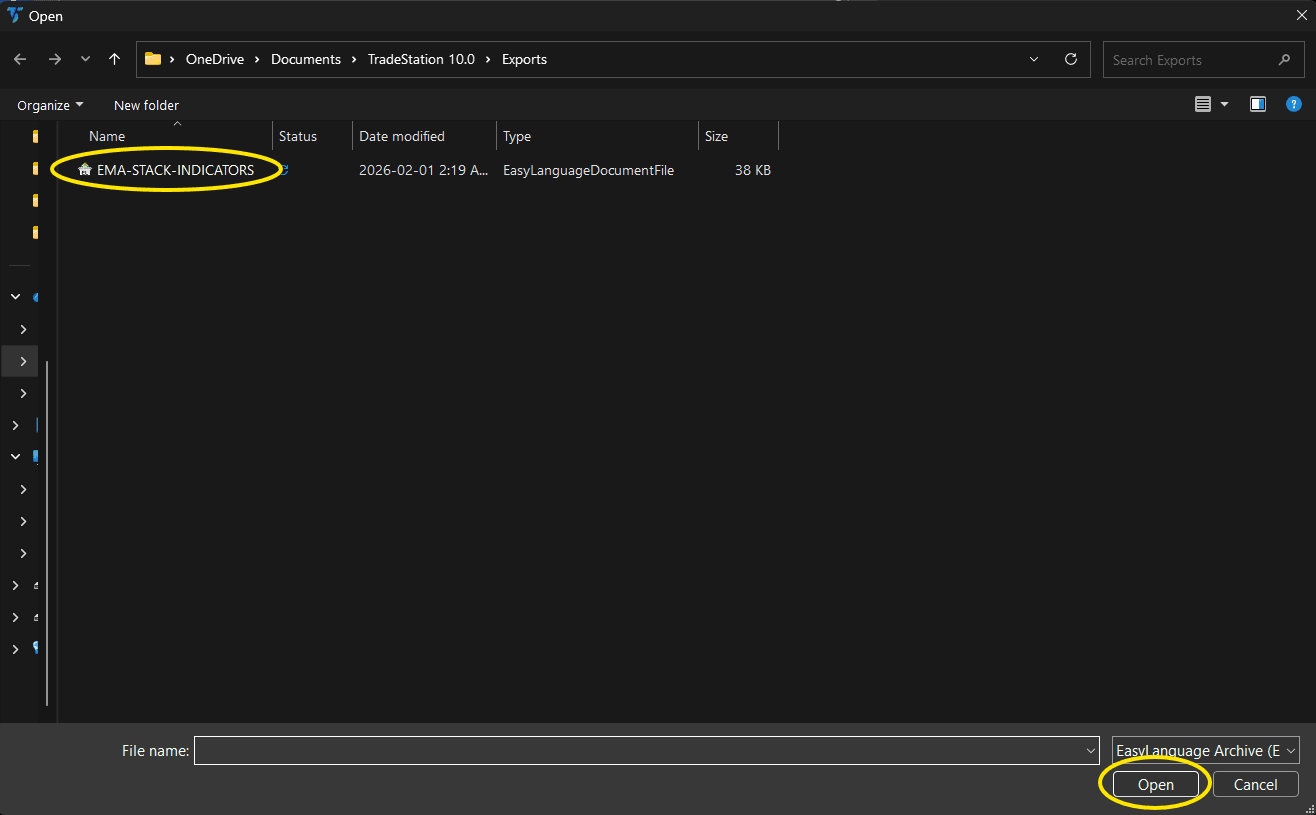
Step 5: Select and open the file
Navigate to the folder where you saved the .ELD file. Select auto-trend-lines-paintbar.eld and click Open. The file name shown may differ from the screenshot — look for your downloaded indicator file.
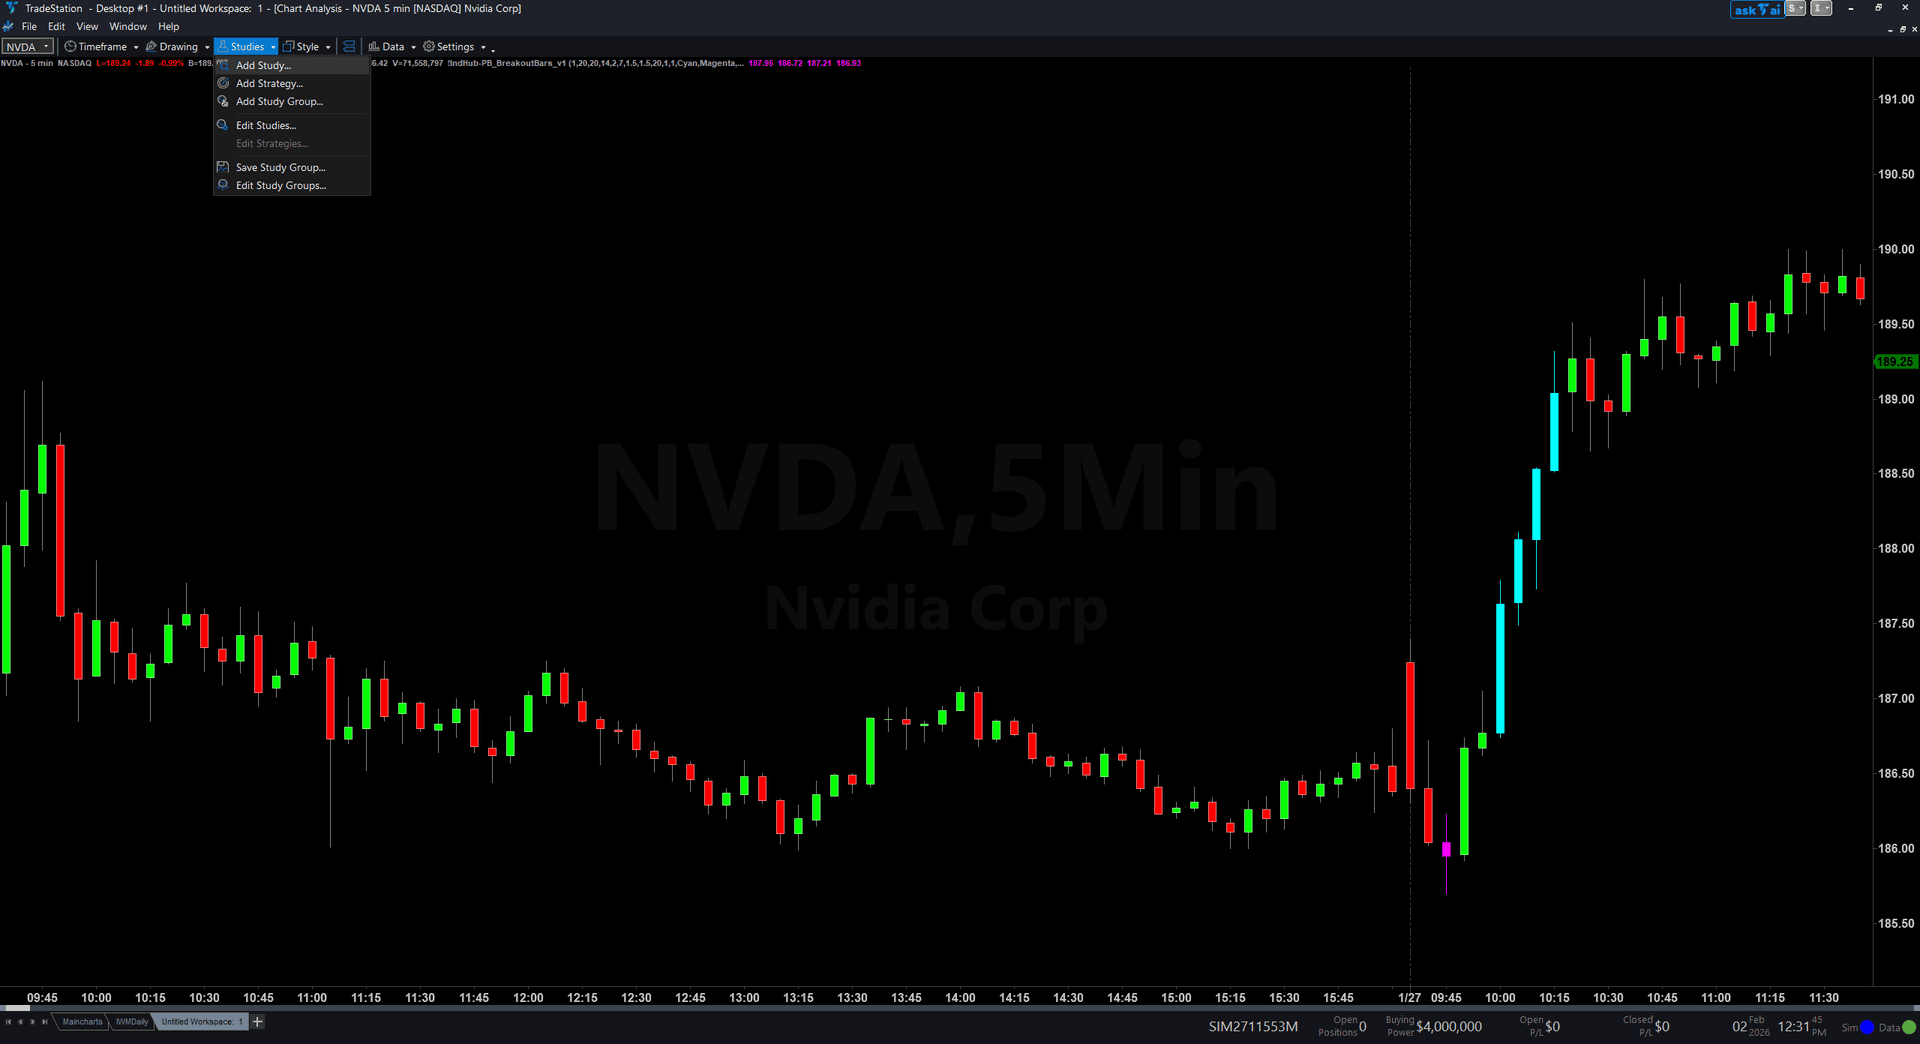
Step 6: Open the Studies menu
On your chart, click the Studies dropdown in the toolbar and select Add Study.
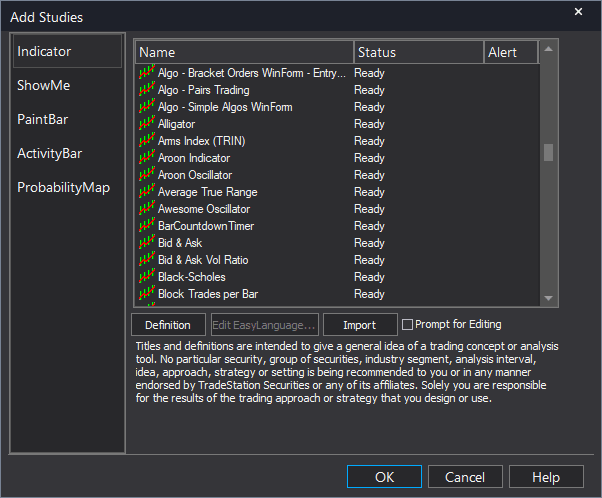
Step 7: Select the PaintBar study
In the Add Studies dialog, click the PaintBar tab on the left side. Find "IIndHub-AutoTrendLinesPaintBar" in the list, select it, and click OK to apply.
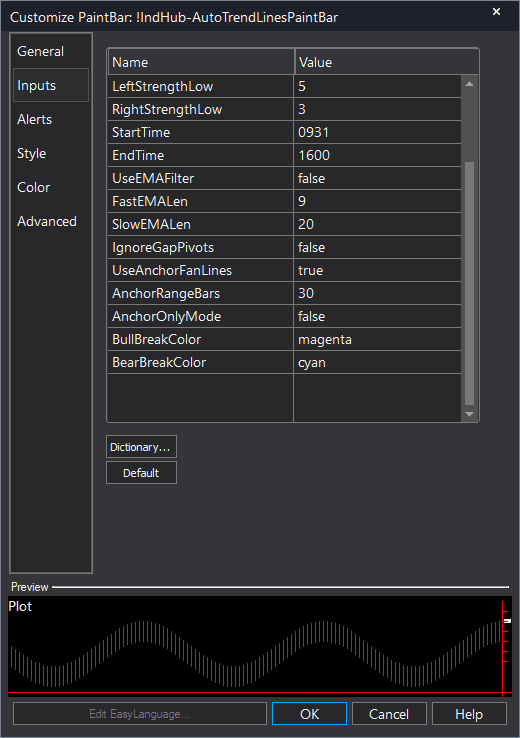
Step 8: Configure settings (optional)
Right-click anywhere on the chart, go to Studies > Edit Studies..., select the study, and click the Inputs tab. Key inputs: BullBreakColor (default magenta), BearBreakColor (default cyan), LeftStrengthLow/RightStrengthLow (default 5/3), StartTime/EndTime (default 0931/1600), AnchorOnlyMode (default false). To change break colors, modify BullBreakColor and BearBreakColor to any TradeStation color name or RGB value.
Common Issues
I do not see any colored bars on my chart. The indicator is applied but nothing is painted.
The PaintBar only colors bars at the exact moment a trend line break occurs. If the market is in a steady trend without any lines being broken, no bars will be painted. This is normal — the absence of colored bars means no break signals are present. Wait for price to approach and break through a trend line. You can also check that StartTime/EndTime settings match your trading session.
Can I change the break colors to something other than magenta and cyan?
Yes. Right-click anywhere on the chart, go to Studies > Edit Studies..., select the study, and click the Inputs tab. Change the BullBreakColor and BearBreakColor inputs. You can enter any TradeStation color name (red, green, yellow, white, etc.) or use custom RGB values. Choose colors that contrast well with your chart's candlestick colors for maximum visibility.
For additional help, contact support.