


Check the idea.
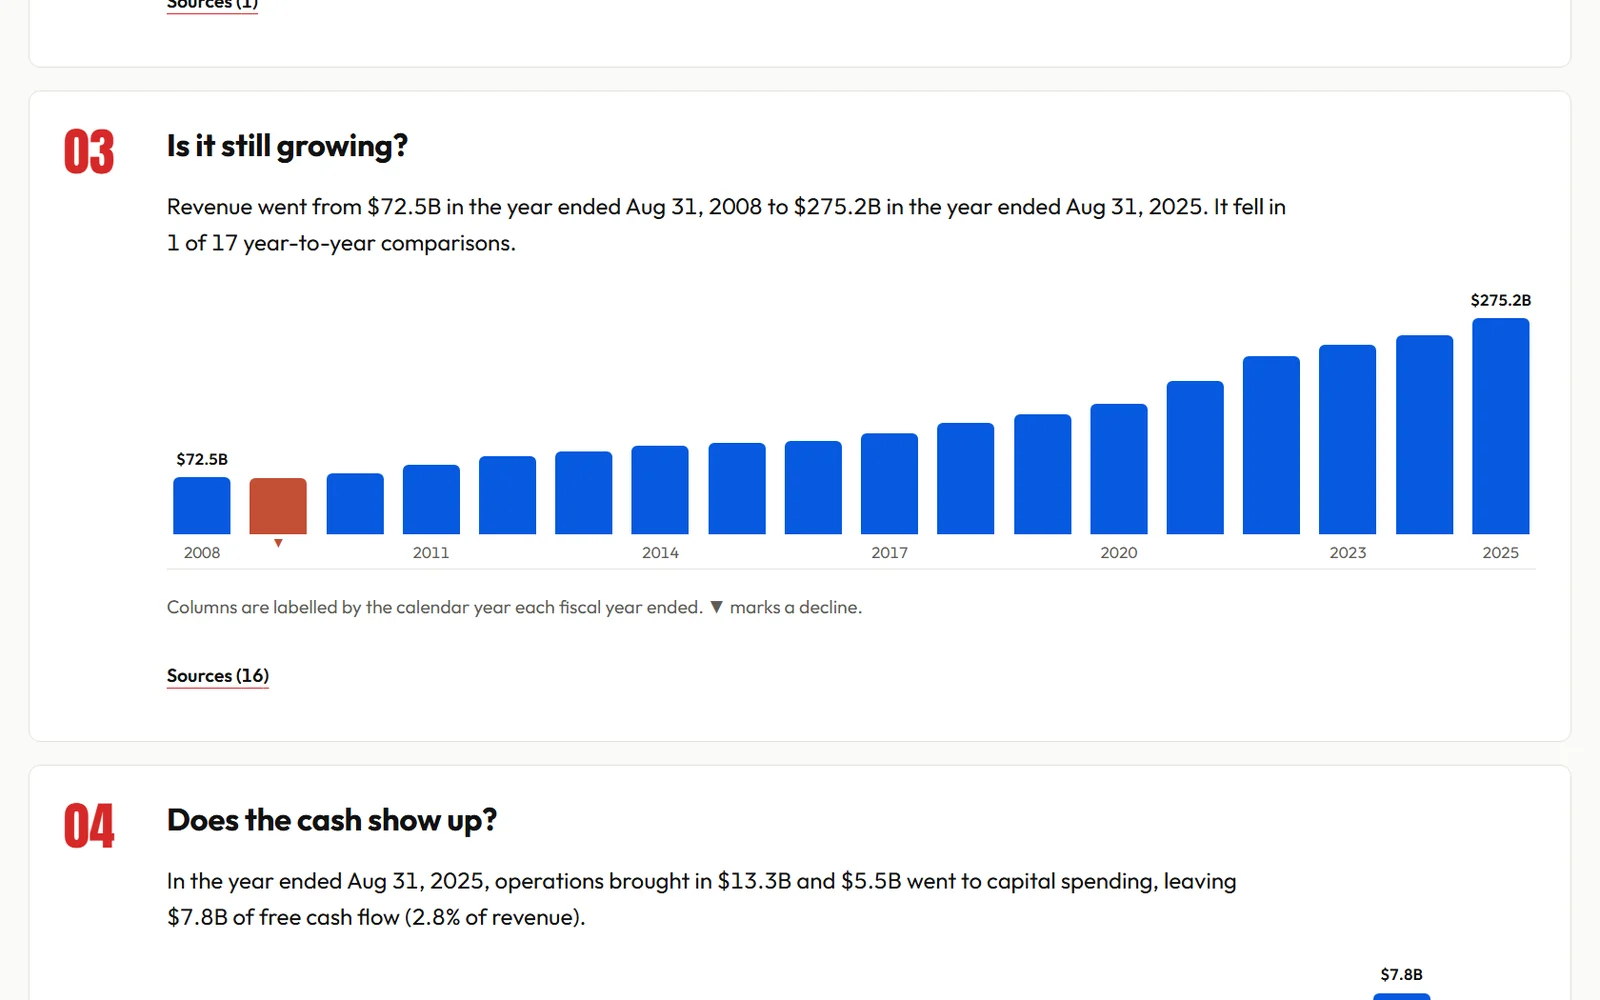
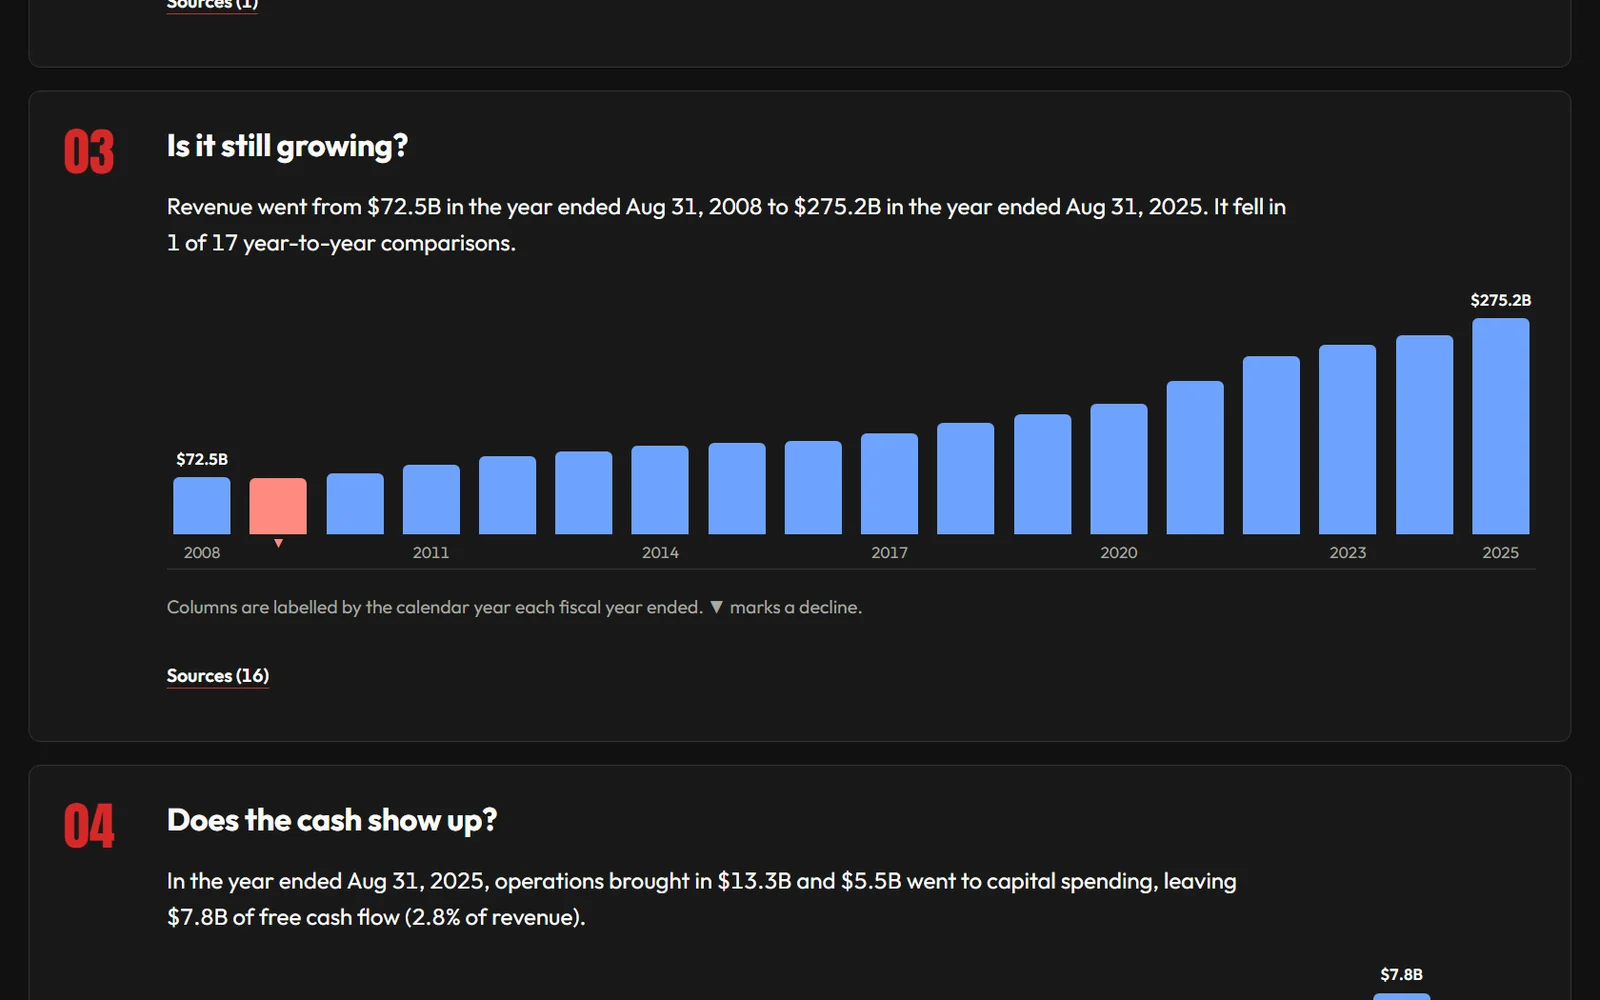
See the chart, company evidence and source dates together. Revenue, profit and cash come from the company’s own filings, and every figure names its period.
Every number links to the filing behind it.FOR PART-TIME US STOCK SWING TRADERS
Bring a stock you are watching. Check its chart, company facts and original sources, identify what could change the story, and save a research case to revisit.
Free membership. Google or email sign-in. No card. Saved research stays in this browser.


Figures are historical; these dated captures are not a live feed or price quote.
A WORKED EXAMPLE: COSTCO
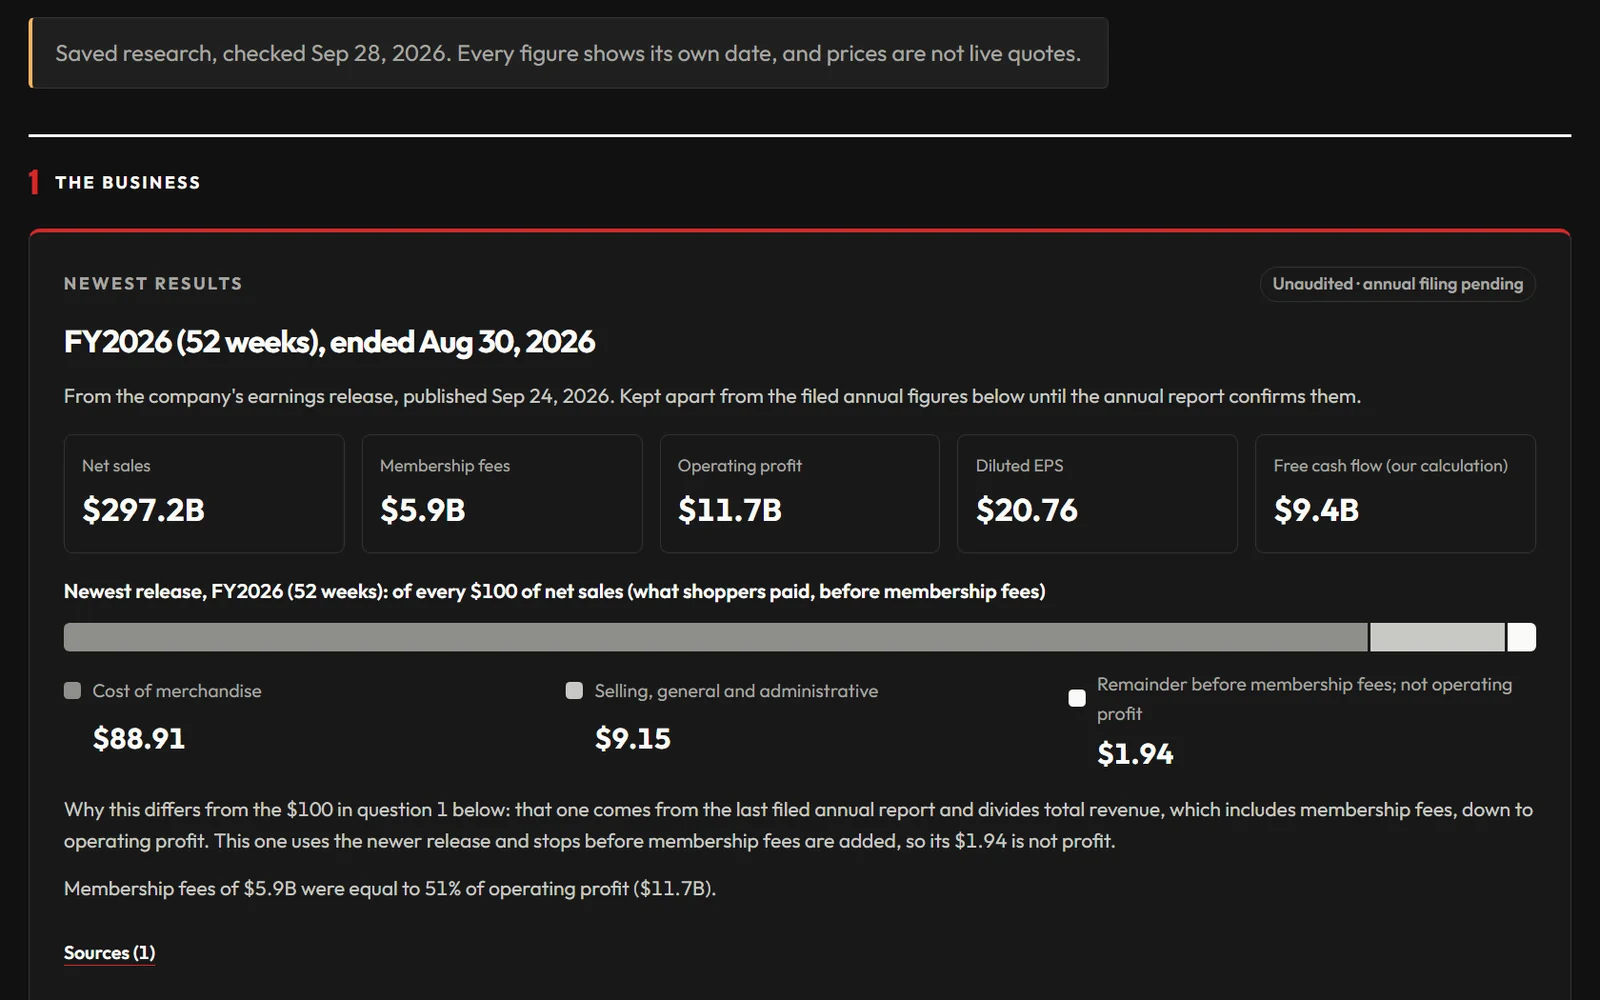
A setup shows what the price did. The company shows why the move might continue, or stop. These views come from one real, dated Costco research page.
See the chart, company evidence and source dates together. Revenue, profit and cash come from the company’s own filings, and every figure names its period.
Every number links to the filing behind it.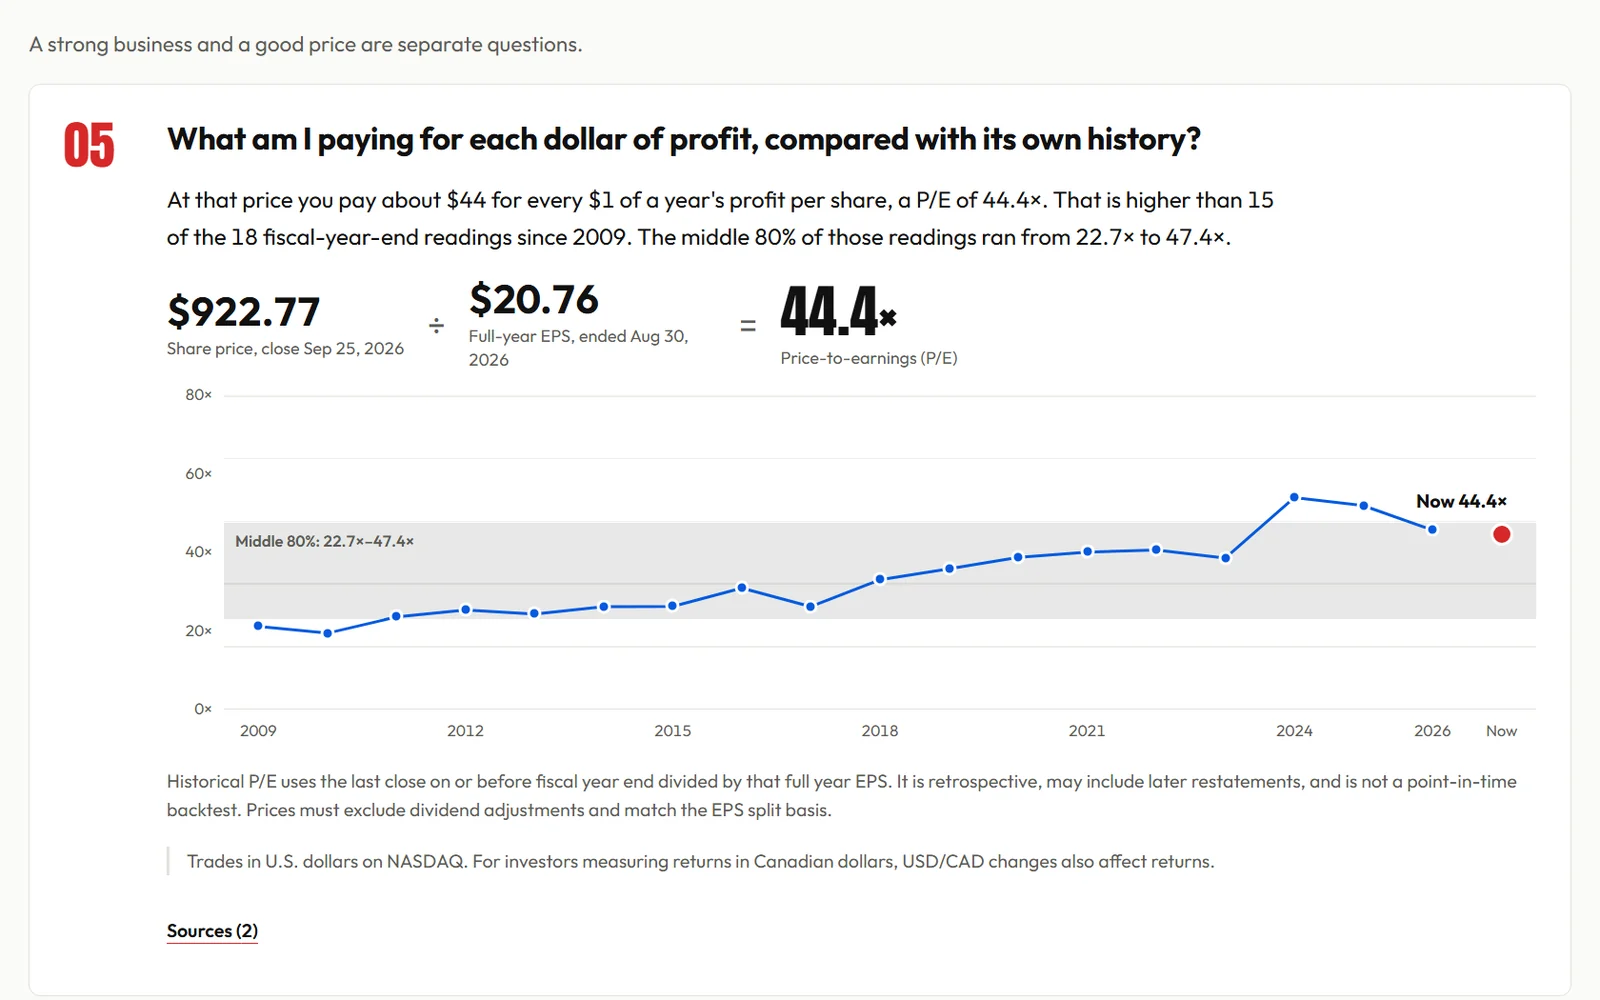
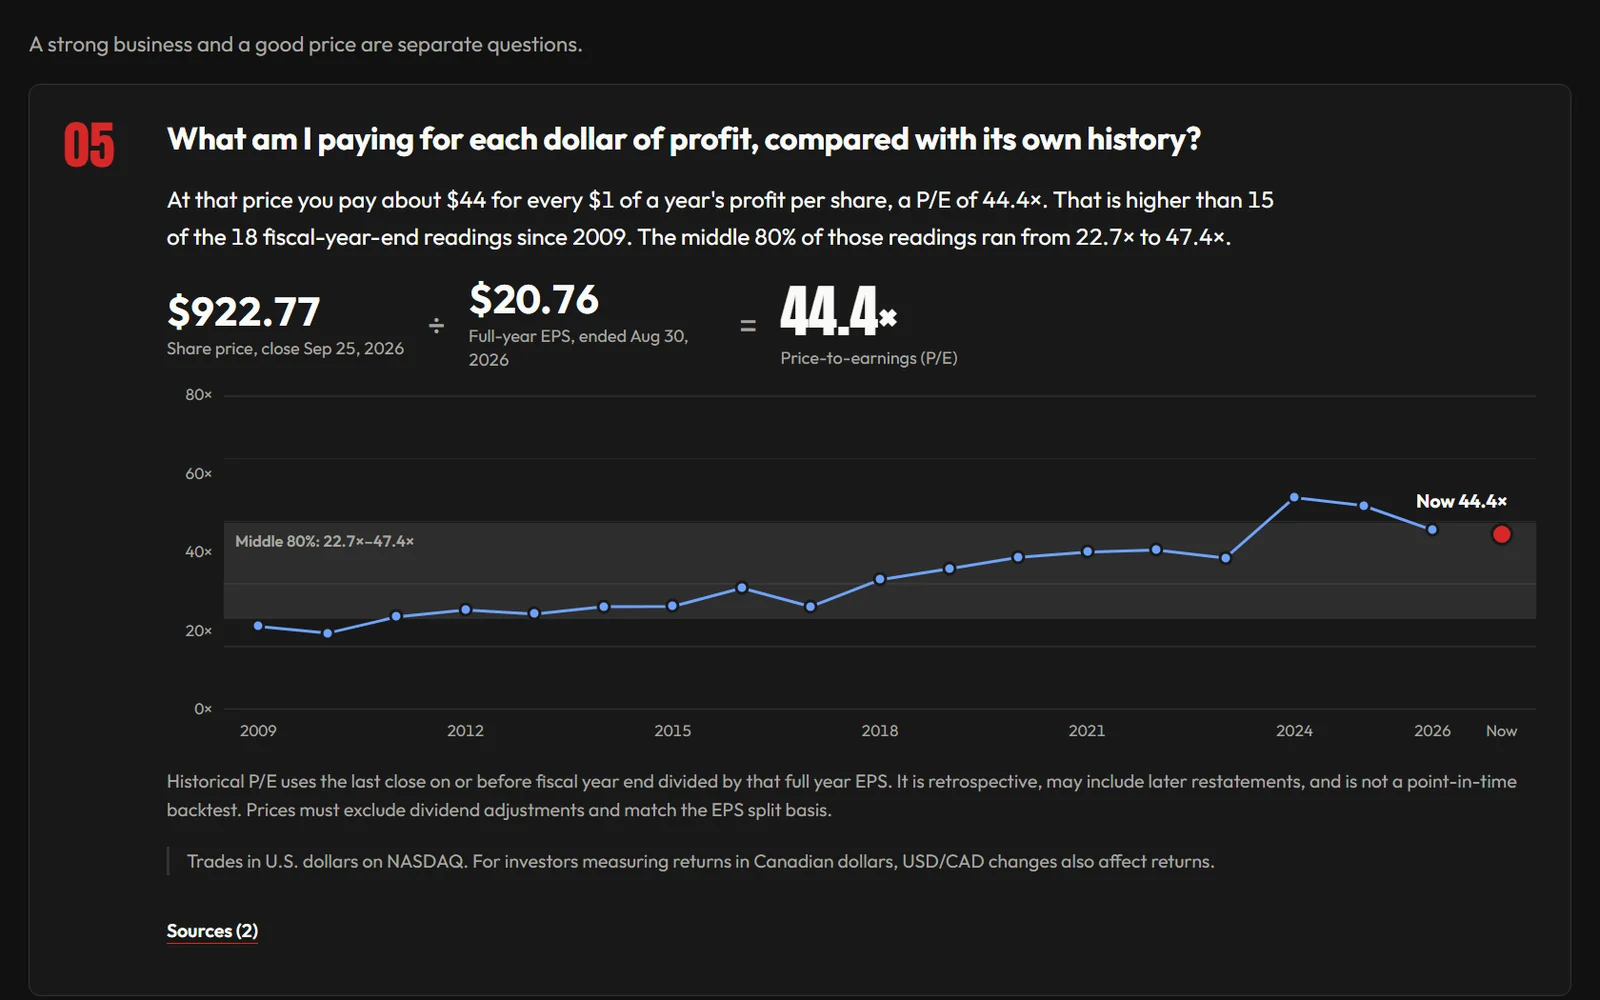
Look for what could weaken the case: what you pay for its profit against its own history, upcoming events and the information that is still missing.
A countercase to weigh, not a prediction.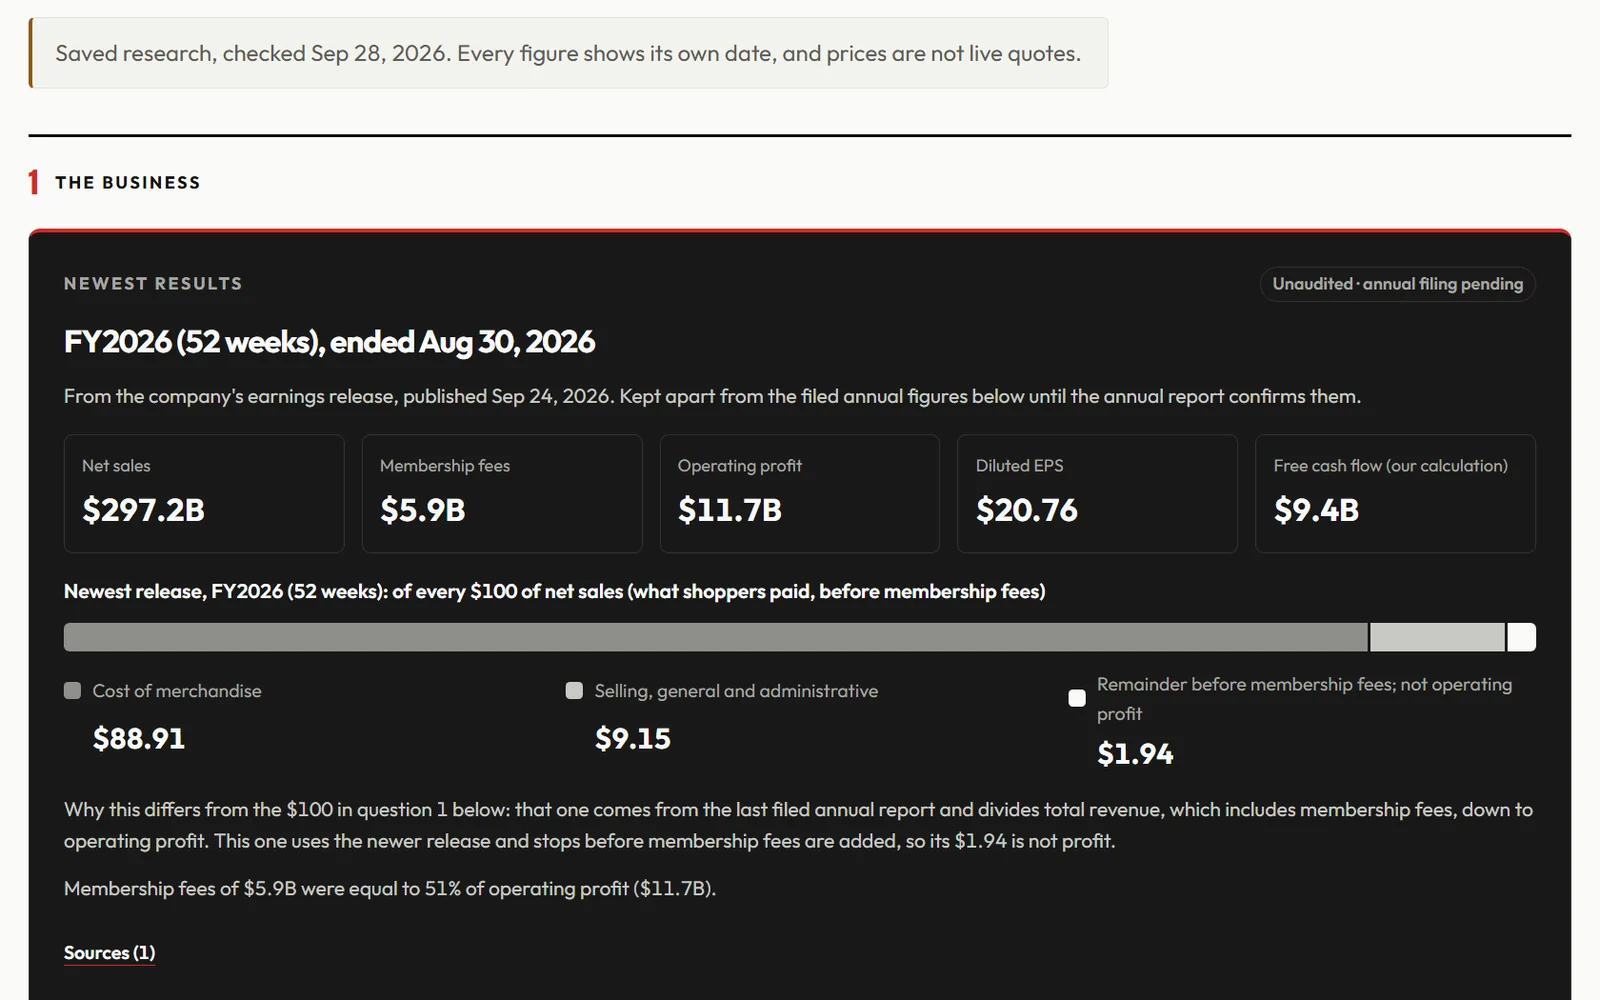
Set your entry, stop and target, size the position to the dollars you will risk, and see after each close where price sits against your plan. New filed figures since you saved are flagged.
Plans and notes stay in this browser.HOW IT WORKS
The same four steps every time, so an idea becomes a case you can explain and revisit.
Search a US company or open a name you saved. The Market scanner is another way to find one.
Inspect the chart and dated technical factors, then the company: financial history from its filings, headlines and the original sources.
Find the conflicting evidence, a question still unanswered and the next relevant event. Confirmed dates are kept apart from estimates.
Save the name and your research question, then come back to review the evidence. Saved research stays in this browser.
Quotes and charts can be delayed. Technical scores describe completed daily end-of-day price history and do not predict returns. Report coverage varies by company.
INSIDE MARKET COMPASS
Start with the stock you are watching. Go wider when the question calls for it, from official market data to the next scheduled catalyst.
Company research
Open a report on any US company: years of revenue, profit and cash from its SEC filings, what you pay for its profit, a peer comparison and the latest filings. Then plan the trade with an entry, stop and position size, and follow it after each close.
Swing Trader Desk
Take a ticker into daily and weekly charts, company headlines and its dated technical score. Compare the setup with the next relevant report before building a multi-day thesis.
MarketCompass Score
The 1–10 long and short reading summarizes daily end-of-day trend, breakout, selling and nearby-level evidence. Open its factor breakdown, source and date. It describes price history; it does not predict a return.
Market intelligence + My watchlist
Save names in My watchlist, then inspect charts, news and filings. Market intelligence and the Sector lens add dated commodity reports and sector context. Treat each relationship as a lead to investigate.
Economic forecasts
Market expectations pairs earlier CBO forecasts with a later official result for a completed quarter. Forecast Beat Score counts which results beat those forecasts; it is not a forecast of market returns.
Day trader desk
Follow active US stocks with short-interval charts, company headlines and a broader market view. The MarketCompass Score remains dated daily end-of-day context, not an intraday signal.
Learn & sources stays available from the workspace sidebar.
YOUR OWN MARKET VIEW STARTS HERE
Explore the tools, follow your markets and decide what the evidence means to you.
Inspect source and observation dates as you research. The workspace images above are dated captures from the actual workspace.
The core briefing covers the US economy and 11 stock-market sectors. Its five indicators come from the New York Fed, US Treasury and BLS. Commodity research adds dated official report evidence where available; stock charts and screeners are provided by TradingView and may be delayed. The calendar links to official release schedules. The homepage slider shows captures from September 28, 2026; the Costco views were captured on September 30, 2026 from research checked September 28. Their figures are point-in-time and the images are not live quotes.
Live market odds and analyst estimates are not connected. The calendar includes selected issuer-confirmed earnings, selected watchlist splits and declared dividend dates, with incomplete company coverage. It also shows ISM and NYSE dates, with optional tentative Treasury auctions and options expirations. Forecast Beat Score compares earlier forecasts with official results for a completed quarter; MarketCompass Score describes dated end-of-day stock or ETF price history when enough licensed data is available. Its source and latest completed bar are shown, and the TradingView chart may use a different feed. What-if scenarios use dated official observations and stated conditions. None predicts returns or recommends trades. Indicator Hub is independent of the source organizations.
YOUR NEXT STOCK IDEA STARTS HERE
Check the evidence, find what could change the story and save a case to revisit. The whole current workspace is free.
THE NEXT CHAPTER / IN RESEARCH
We’re designing a five-trading-day view for investors who follow futures, commodities and global markets. Explore where the evidence could connect across markets.
US and Canadian crop projections, condition, acreage, production, stocks and export sales, with the crop year and each revision kept in view.
An investor following grain futures or food producers could separate a new supply or demand revision from a seasonal comparison, then see which official report comes next.
Coverage note: Official projections are forecasts. Weather context is not a yield forecast.
EIA oil and natural-gas inventories, production, refinery activity and official outlooks, plus slower official metal production and trade reports where usable.
For oil, gas or resource holdings, a dated seasonal comparison could put an inventory change in context and show whether a longer-term supply outlook supports the same story.
Coverage note: Exchange inventories and price curves need separate display and data-rights approval.
Researched chokepoint activity, vessel-class changes, official weather alerts and crop-region maps, tied to relevant markets only when coverage and rights are confirmed.
An investor with commodity or industrial exposure could spot transport and weather risks to investigate before assuming a headline affects a particular contract.
Coverage note: Vessel traffic does not identify each ship’s cargo. Route links show exposure, not measured cargo flow.
Dated currency reference rates, central-bank and release calendars, official regional data and linked publisher headlines grouped by country or market.
For international holdings, currencies and policy can change the backdrop for company revenue, costs and returns. A regional view helps put those exposures beside the markets you follow.
Coverage note: Reference rates are not live quotes. News links do not republish article text or images.
CFTC weekly positions across agricultural, energy, metal and financial futures, clearly separating Tuesday’s position date from the later publication date.
A futures investor could compare a positioning change with upcoming reports and other evidence, instead of mistaking a delayed weekly report for live sentiment.
Coverage note: Positioning alone does not predict the next price move.
A market-centered driver board with the latest report, next catalyst, relevant news, conflicting observations, source links and publication times.
Over a five-trading-day window, an investor could test a thesis against alternative explanations and see whether the strongest evidence is fresh, direct and comparable.
Coverage note: A driver is a qualified judgment, not proven causation or a trade signal. Any score needs validation first.
This expanded cross-market view is in research. The current workspace includes selected commodity reports and charts; broader source coverage, connections and interpretations still require rights, quality and product review. Depth will vary by contract and region.