Auto Trend Lines RadarScreen
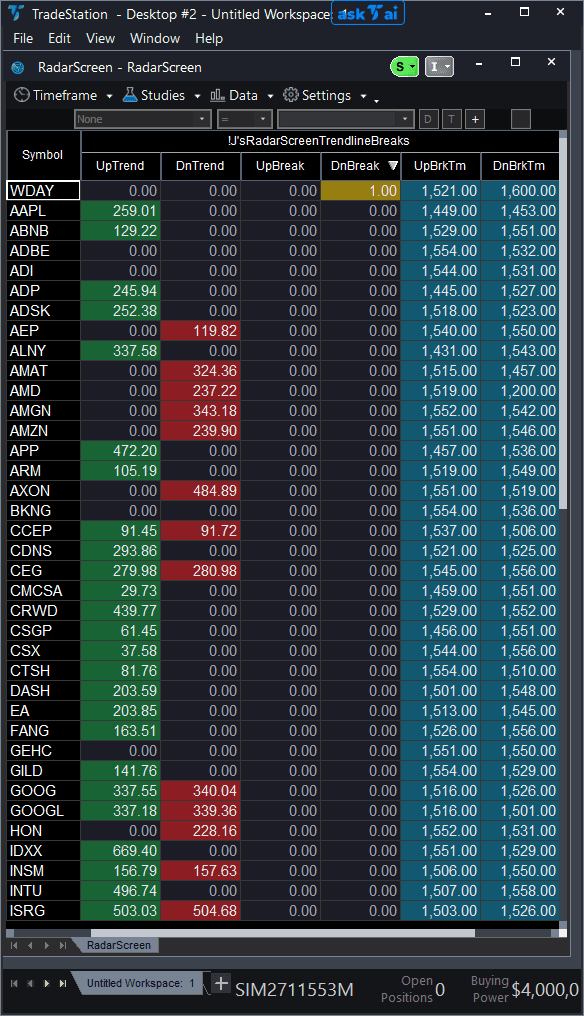
Auto Trend Lines RadarScreen brings trend line break detection to your watchlist scanning workflow, eliminating the need to flip through dozens of charts checking for breaks. This RadarScreen version monitors uptrend and downtrend lines for every symbol in your watchlist and alerts you the moment a break occurs, with sortable columns showing break direction, trend values, and exact break timestamps.
- ●UpTrend and DnTrend columns show the current trend line values for each symbol, color-coded green (uptrend present) and red (downtrend present) for instant visual scanning
- ●UpBreak and DnBreak columns flash when price breaks through a trend line — sort by these columns to catch breaks as they happen
- ●UpBrkTm and DnBrkTm columns record the exact bar time of the last break signal, so you know how recent each signal is
- ●StartTime/EndTime filters (default 9:31 AM to 4:00 PM) restrict analysis to regular trading hours, avoiding false signals from pre-market and after-hours data
- ●AnchorOnlyMode option focuses on breaks of only the most significant trend lines, filtering out minor pivot breaks
Sort by DnBreak or UpBreak descending to see symbols with active break signals at the top. Yellow-highlighted cells indicate a break happening right now. Check the break timestamp columns to confirm the signal is fresh.
All break signals use completed bar data only, ensuring you never see a signal that disappears on refresh. Non-repainting guaranteed.
30-Day Money-Back Guarantee
Try it risk-free. Not satisfied? Full refund, no questions asked.
Part of the Auto Trend Lines System
Get all 4 study types for $65 — save $30
Who This Is For
Built for active day traders managing 30-100 symbol watchlists who trade trend line breakouts and breakdowns. Use this to monitor your entire universe for break signals without opening a single chart, then switch to the chart indicator for entry timing and confirmation.
Add Auto Trend Lines RadarScreen to your main watchlist window. During market hours, sort by UpBreak or DnBreak to catch break signals in real time. Check the UpBrkTm/DnBrkTm columns to see how recently the break fired — signals within the last few bars are the most actionable.
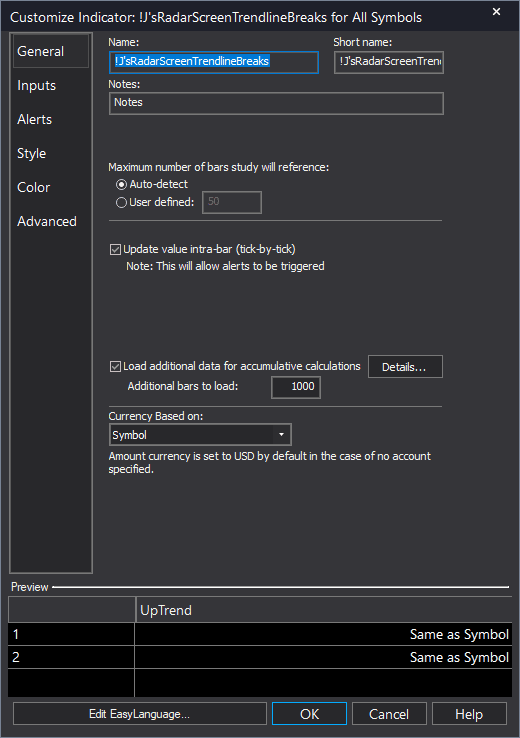
Important: RadarScreen indicators require additional bars to be loaded for the trend line calculations. Set the additional bars to at least 1000 in the General settings tab. Without sufficient bars loaded, the indicator cannot calculate trend lines and columns will show zeros.
Use the first hour of trading (9:31-10:30 AM ET) actively — this is when the most breakout signals occur as overnight levels get tested. Re-scan at lunch for afternoon setups. Review break timestamps at market close to identify symbols that may continue trending the next day.
See It in Action
Example chart showing Auto Trend Lines RadarScreen on a live trading session
Example chart showing Auto Trend Lines RadarScreen on a live trading session
Installation Guide
Step 1: Download the indicator file
After purchase, download auto-trend-lines-radarscreen.eld from your confirmation email or account download page. Save it somewhere easy to find like your Desktop or Downloads folder.
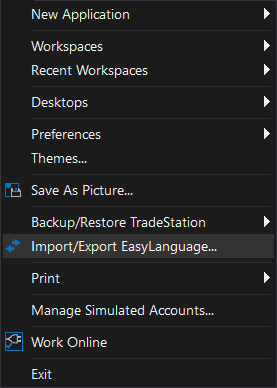
Step 2: Open the Import Wizard
Open TradeStation. Click the File menu in the top-left corner, then select Import/Export EasyLanguage to launch the Import/Export Wizard.
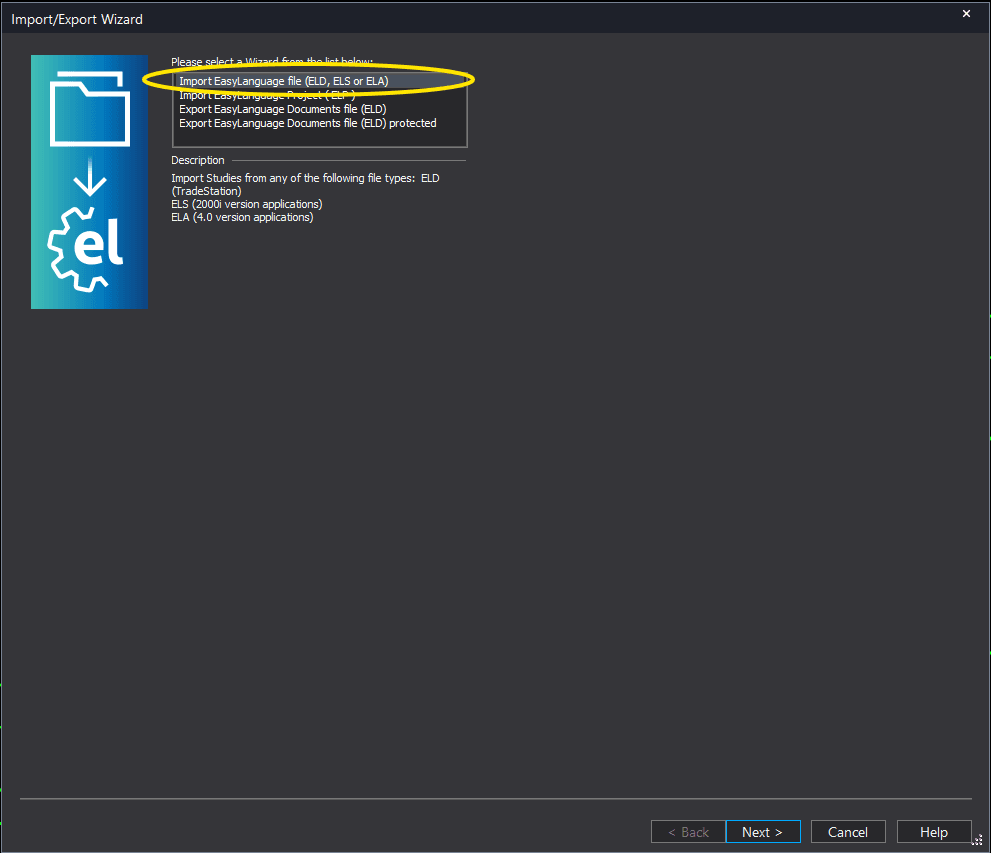
Step 3: Select the import type
In the Import/Export Wizard, select "Import EasyLanguage file (ELD, ELS or ELA)" from the list. Click Next to continue.
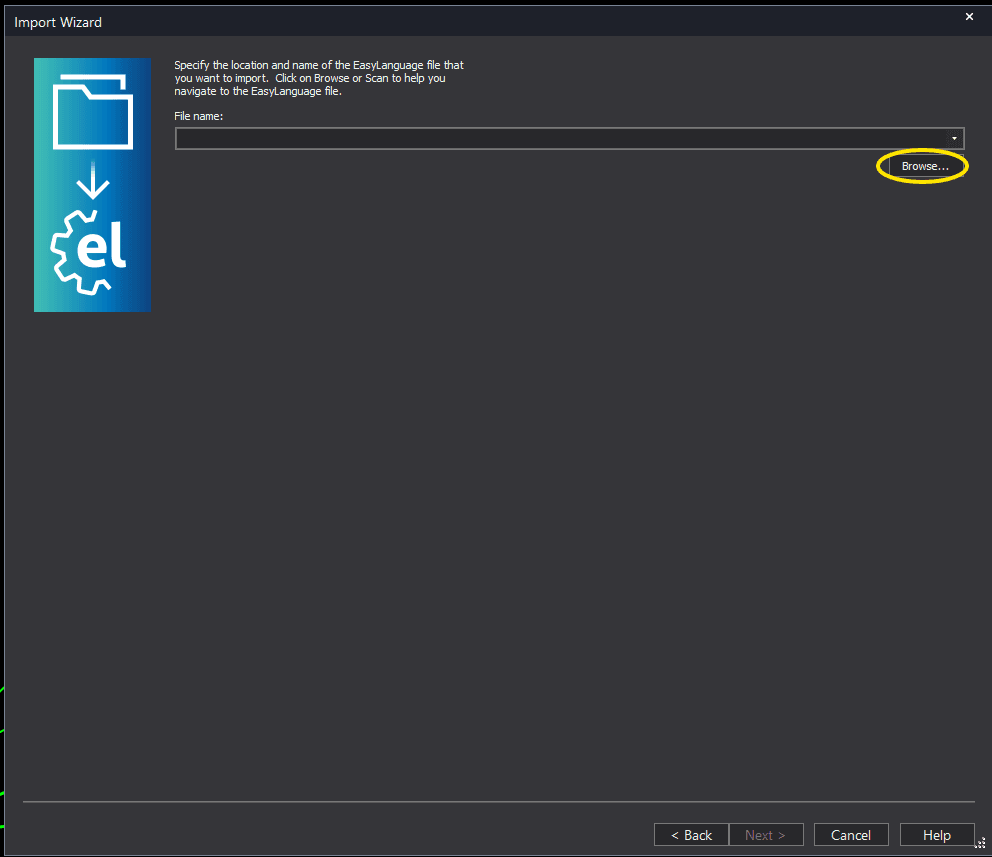
Step 4: Browse for the file
Click the Browse button to open a file browser where you can locate your downloaded .ELD file.
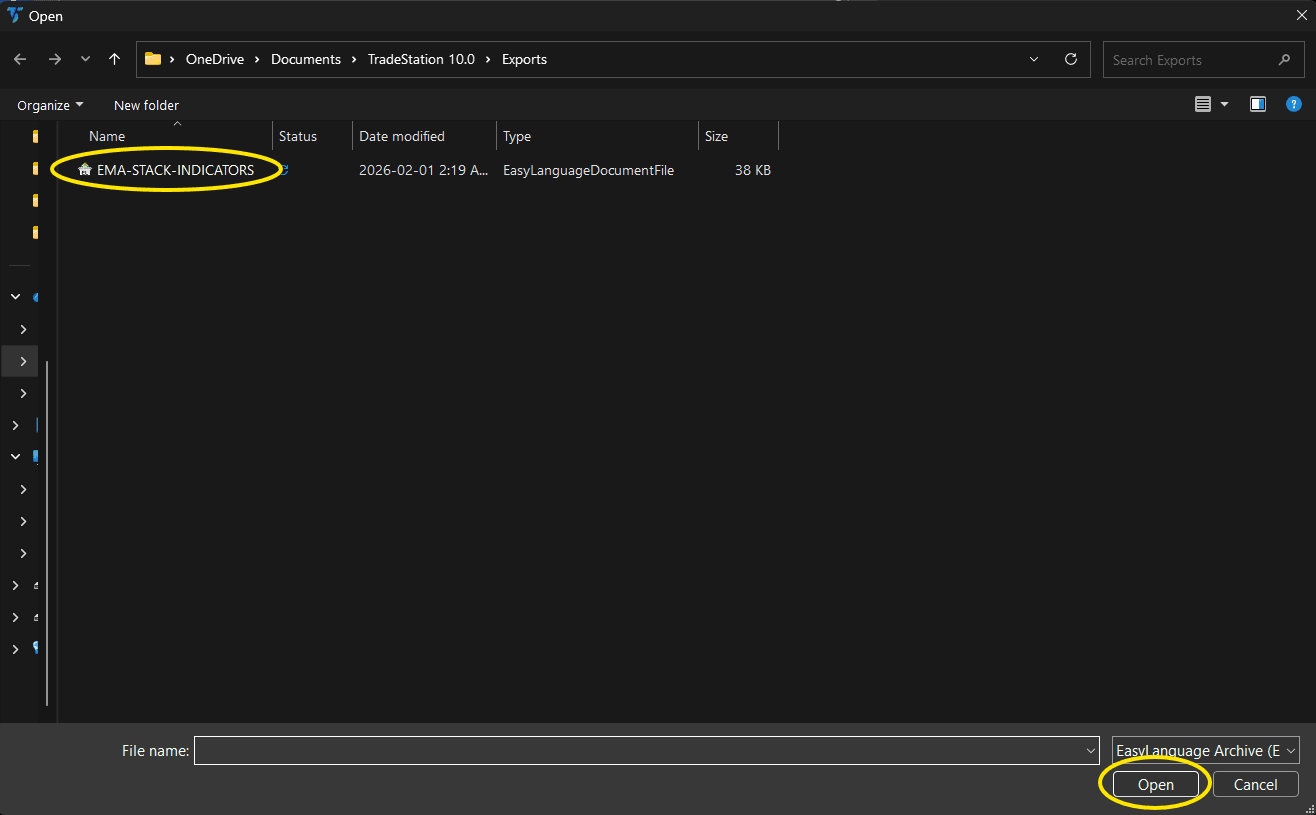
Step 5: Select and open the file
Navigate to the folder where you saved the .ELD file. Select auto-trend-lines-radarscreen.eld and click Open. The file name shown may differ from the screenshot — look for your downloaded indicator file.
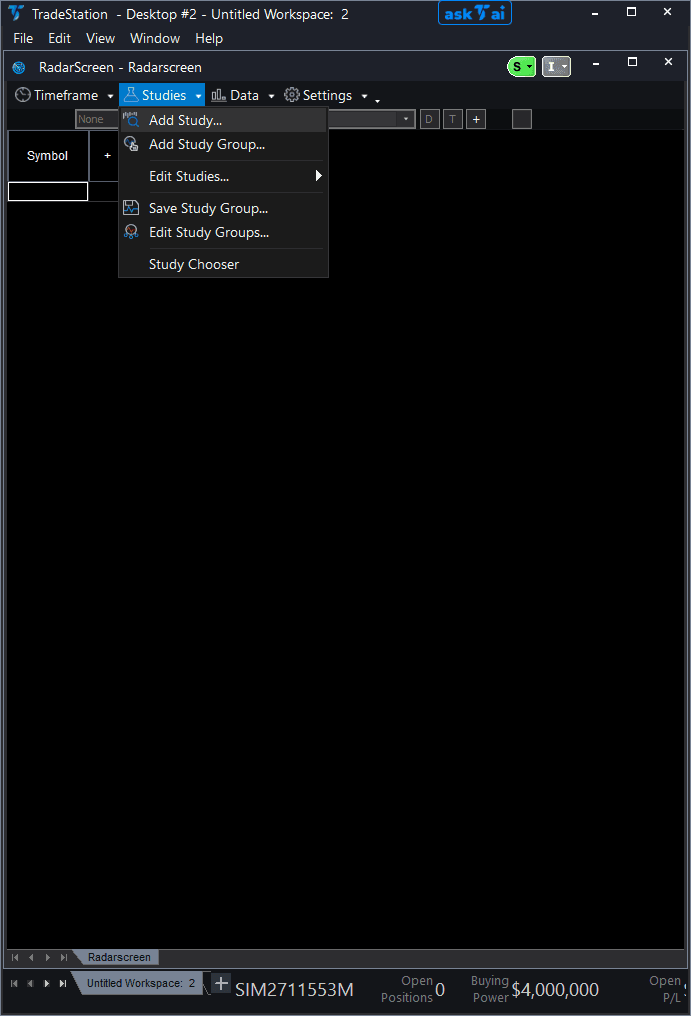
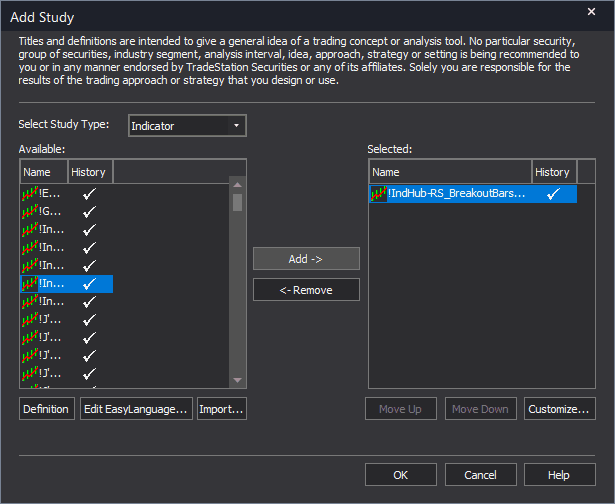
Step 6: Open the Studies menu
Open your RadarScreen window. Click the Studies dropdown in the toolbar and select Add Study.
Step 7: Select the indicator
In the Add Study dialog, make sure Indicator is selected in the Study Type dropdown. Find "IJ'sRadarScreenTrendlineBreaks" in the Available list, select it, and click Add. Click OK to apply. Important: Go to the General tab and set additional bars to load to at least 1000. Without this, the indicator cannot calculate trend lines.
Step 8: Configure your watchlist and columns
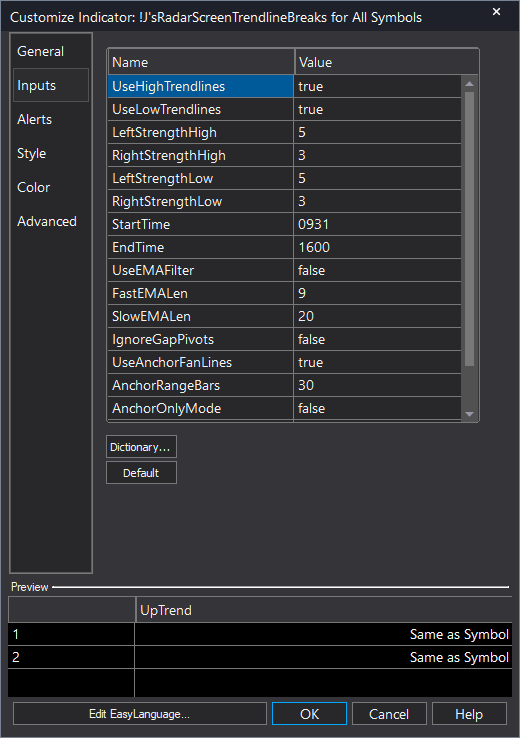
Add your symbols to the RadarScreen watchlist. Adjust column widths. Key inputs: LeftStrength/RightStrength (pivot sensitivity), StartTime/EndTime (session hours, default 0931-1600), UseAnchorFanLines (default true), AnchorOnlyMode (default false, set true for major levels only).
Common Issues
All columns show zeros for every symbol. Nothing is loading.
RadarScreen trend line indicators require additional historical bars to calculate pivot points and draw trend lines. Right-click the indicator column header, go to Studies > Edit for All Symbols..., click the General tab, and ensure 'Load additional data for accumulative calculations' is checked with at least 1000 additional bars. Without sufficient data, the indicator cannot find enough pivots to construct trend lines.
The UpBreak or DnBreak column flashes a signal but when I open the chart I do not see the break.
This is likely a timeframe mismatch. RadarScreen calculates on the timeframe set in the RadarScreen interval selector (bottom-right corner of the RadarScreen window). If your RadarScreen is set to 5-minute but your chart is on 1-minute, the trend lines and break signals will differ. Match the RadarScreen interval to the chart timeframe you are trading.
Can I use this to scan for breaks on daily charts?
Yes. Set the RadarScreen interval to Daily. Increase the additional bars loaded to 2000+ to ensure enough daily bars exist for trend line construction. Adjust LeftStrength/RightStrength to higher values (10/7 or more) for daily pivot sensitivity. Remove or widen the StartTime/EndTime filter since it is designed for intraday session filtering.
For additional help, contact support.