Auto Trend Lines ShowMe
Auto Trend Lines ShowMe marks the exact bars where price breaks through automatically-drawn trend lines, plotting colored dots and data annotations that give you immediate confirmation of break strength. Green dots appear at uptrend break points (bullish breaks above resistance). Red dots appear at downtrend break points (bearish breaks below support). Each dot includes volume percentage change and range percentage data so you can instantly assess whether the break has conviction.
- ●Green dots mark bars that break above a downtrend resistance line — potential long entry signals
- ●Red dots mark bars that break below an uptrend support line — potential short entry or exit signals
- ●Volume percentage (V) shows how the break bar's volume compares to the average — high volume breaks are more reliable
- ●Range percentage (R) shows the break bar's range compared to average — large range breaks indicate strong momentum
- ●ShowVolBreakout and ShowRangeBreakout inputs let you toggle the data annotations on or off for a cleaner chart view
- ●LookbackBars (default 20) controls the comparison period for volume and range percentage calculations
The most reliable break signals combine a break dot with above-average volume (V positive) and above-average range (R positive). When both metrics are elevated, the break has genuine institutional participation behind it. Low volume or small range breaks are more likely to reverse.
All break signals are guaranteed non-repainting. Once a dot plots on a completed bar, it will never disappear.
30-Day Money-Back Guarantee
Try it risk-free. Not satisfied? Full refund, no questions asked.
Part of the Auto Trend Lines System
Get all 4 study types for $65 — save $30
Who This Is For
Auto Trend Lines ShowMe is designed for traders who want objective, data-driven confirmation at trend line break points. Instead of guessing whether a break is real or a false breakout, you get immediate volume and range metrics that quantify the strength of the move.
Layer this study on top of the Auto Trend Lines chart indicator to see both the trend lines and the break annotations together. The trend lines show you where the levels are, and the ShowMe dots tell you when and how strongly those levels were broken.
Use it on 1-minute to 15-minute charts for intraday break trading. Focus on break bars where volume percentage (V) is above +50% and range percentage (R) is positive — these represent strong, committed breaks. Ignore breaks with negative or low volume percentages — they are more likely to fail and reverse back inside the trend line.
Works on any liquid market. Best results on stocks and futures with consistent volume patterns where the volume comparison is meaningful.
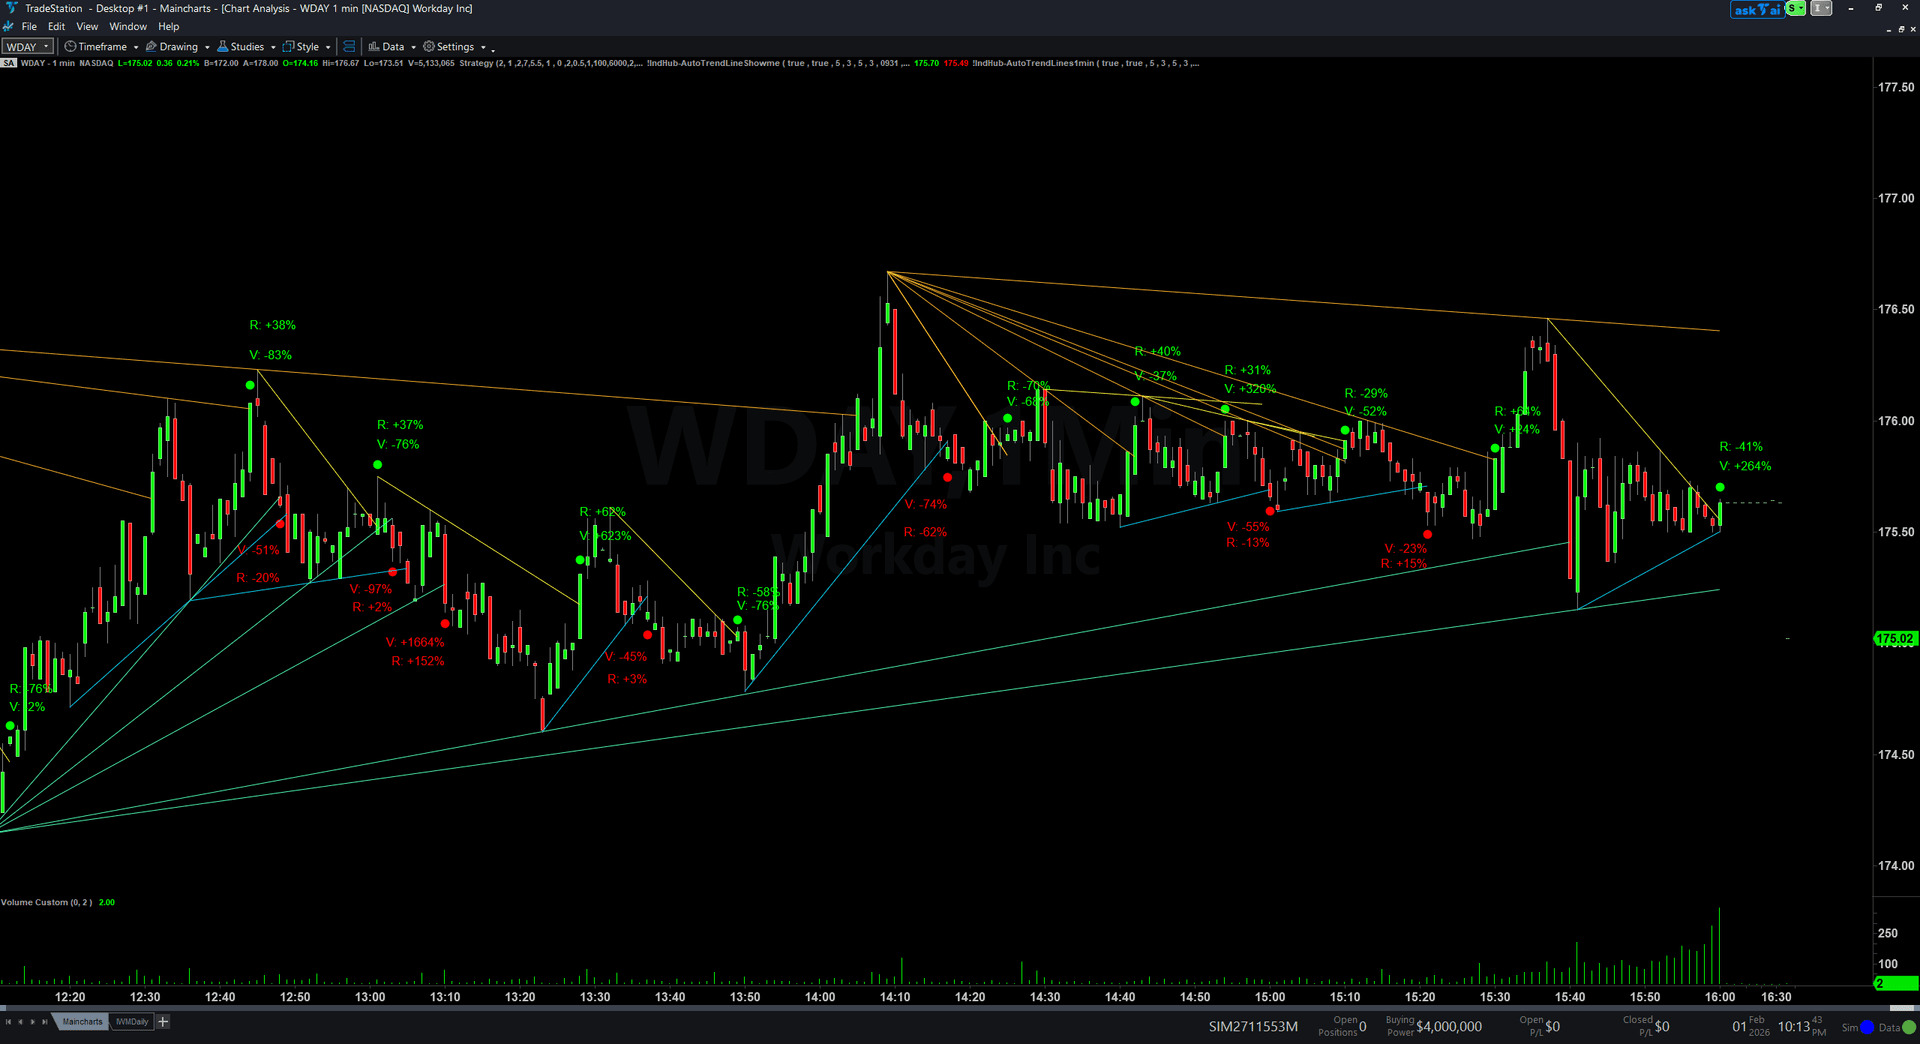
See It in Action
Example chart showing Auto Trend Lines ShowMe on a live trading session
Installation Guide
Step 1: Download the indicator file
After purchasing, you will receive a download link via email. Click the link and save the auto-trend-lines-showme.eld file to your computer. Save it somewhere easy to find like your Desktop or Downloads folder.
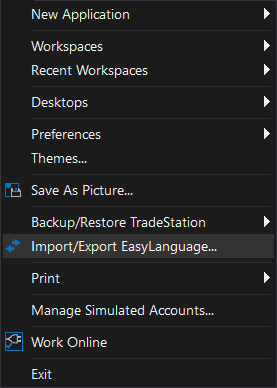
Step 2: Open the Import Wizard
Open TradeStation. Click the File menu in the top-left corner, then select Import/Export EasyLanguage to launch the Import/Export Wizard.
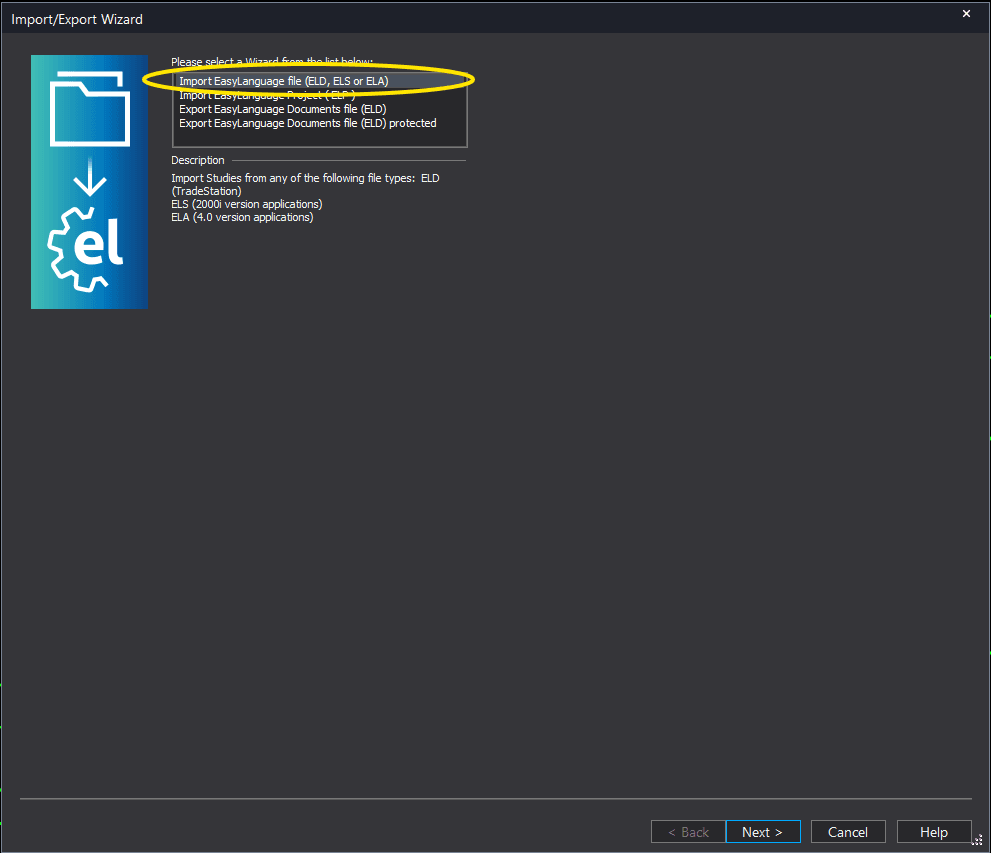
Step 3: Select the import type
In the Import/Export Wizard, select "Import EasyLanguage file (ELD, ELS or ELA)" from the list. Click Next to continue.
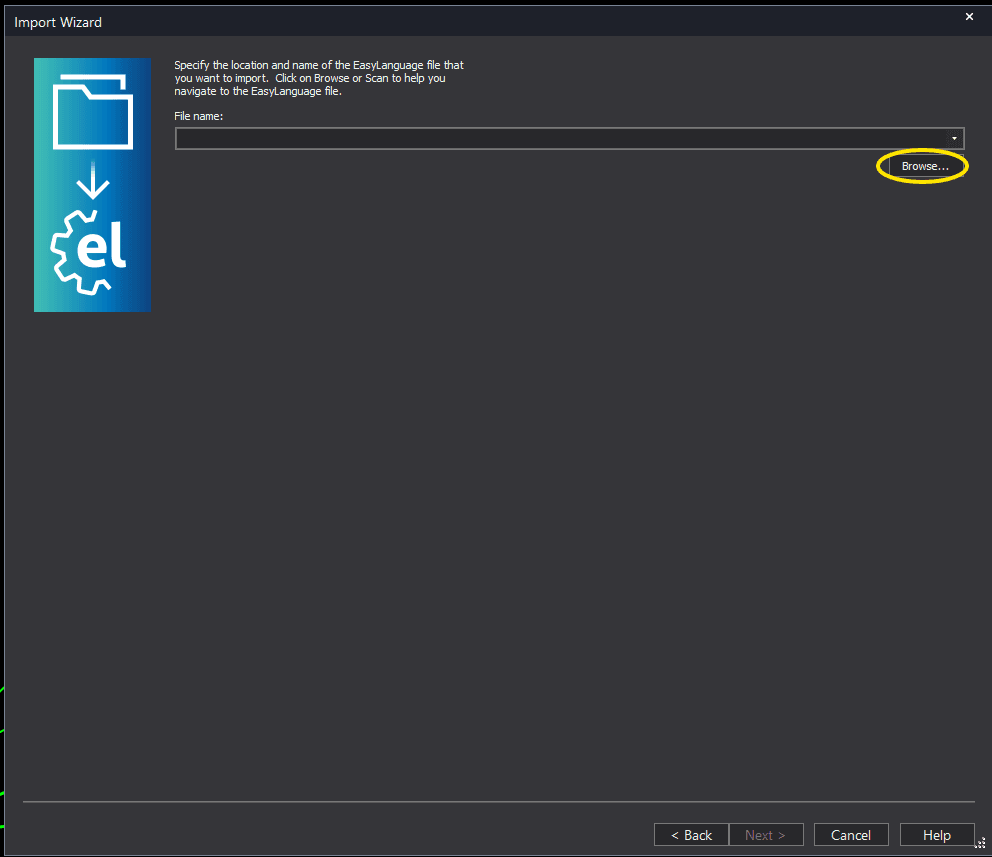
Step 4: Browse for the file
Click the Browse button to open a file browser where you can locate your downloaded .ELD file.
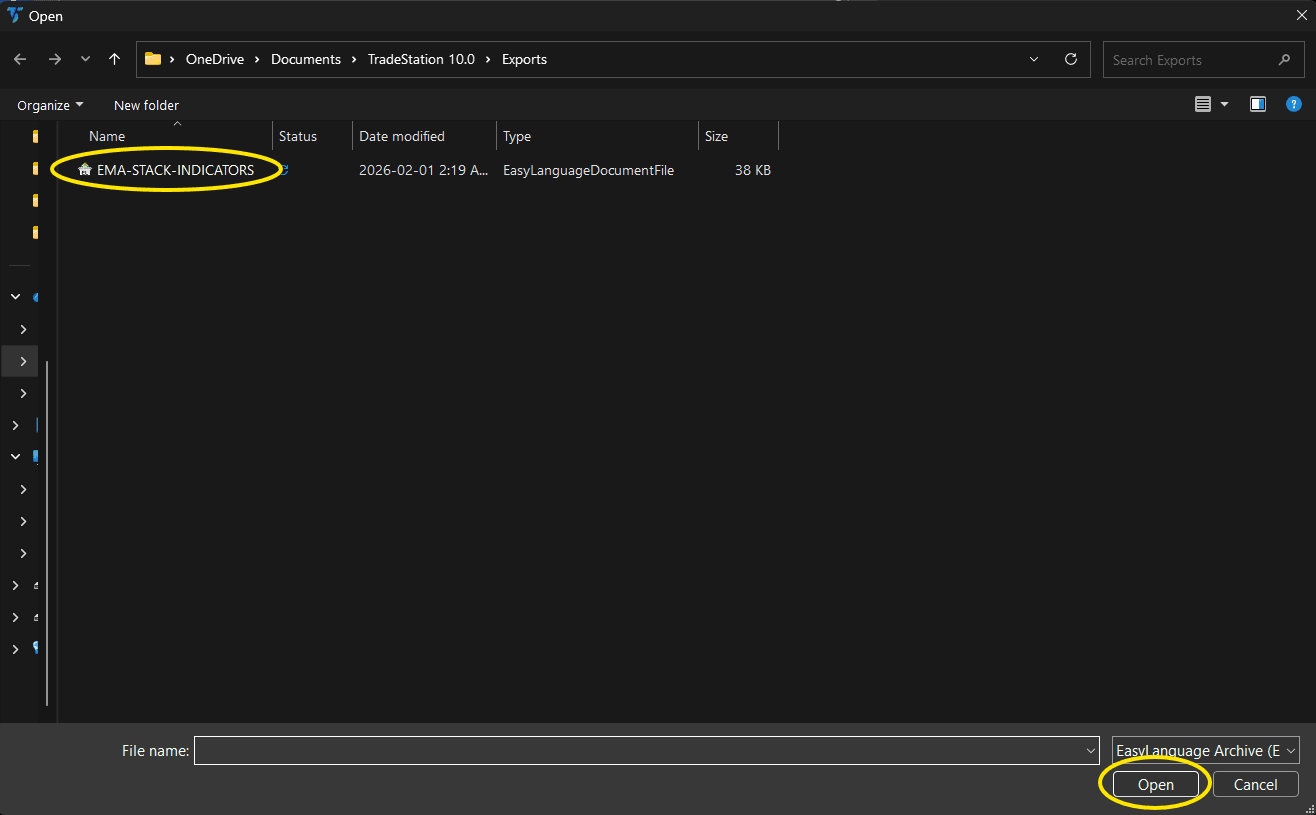
Step 5: Select and open the file
Navigate to the folder where you saved the .ELD file. Select auto-trend-lines-showme.eld and click Open. The file name shown may differ from the screenshot — look for your downloaded indicator file.
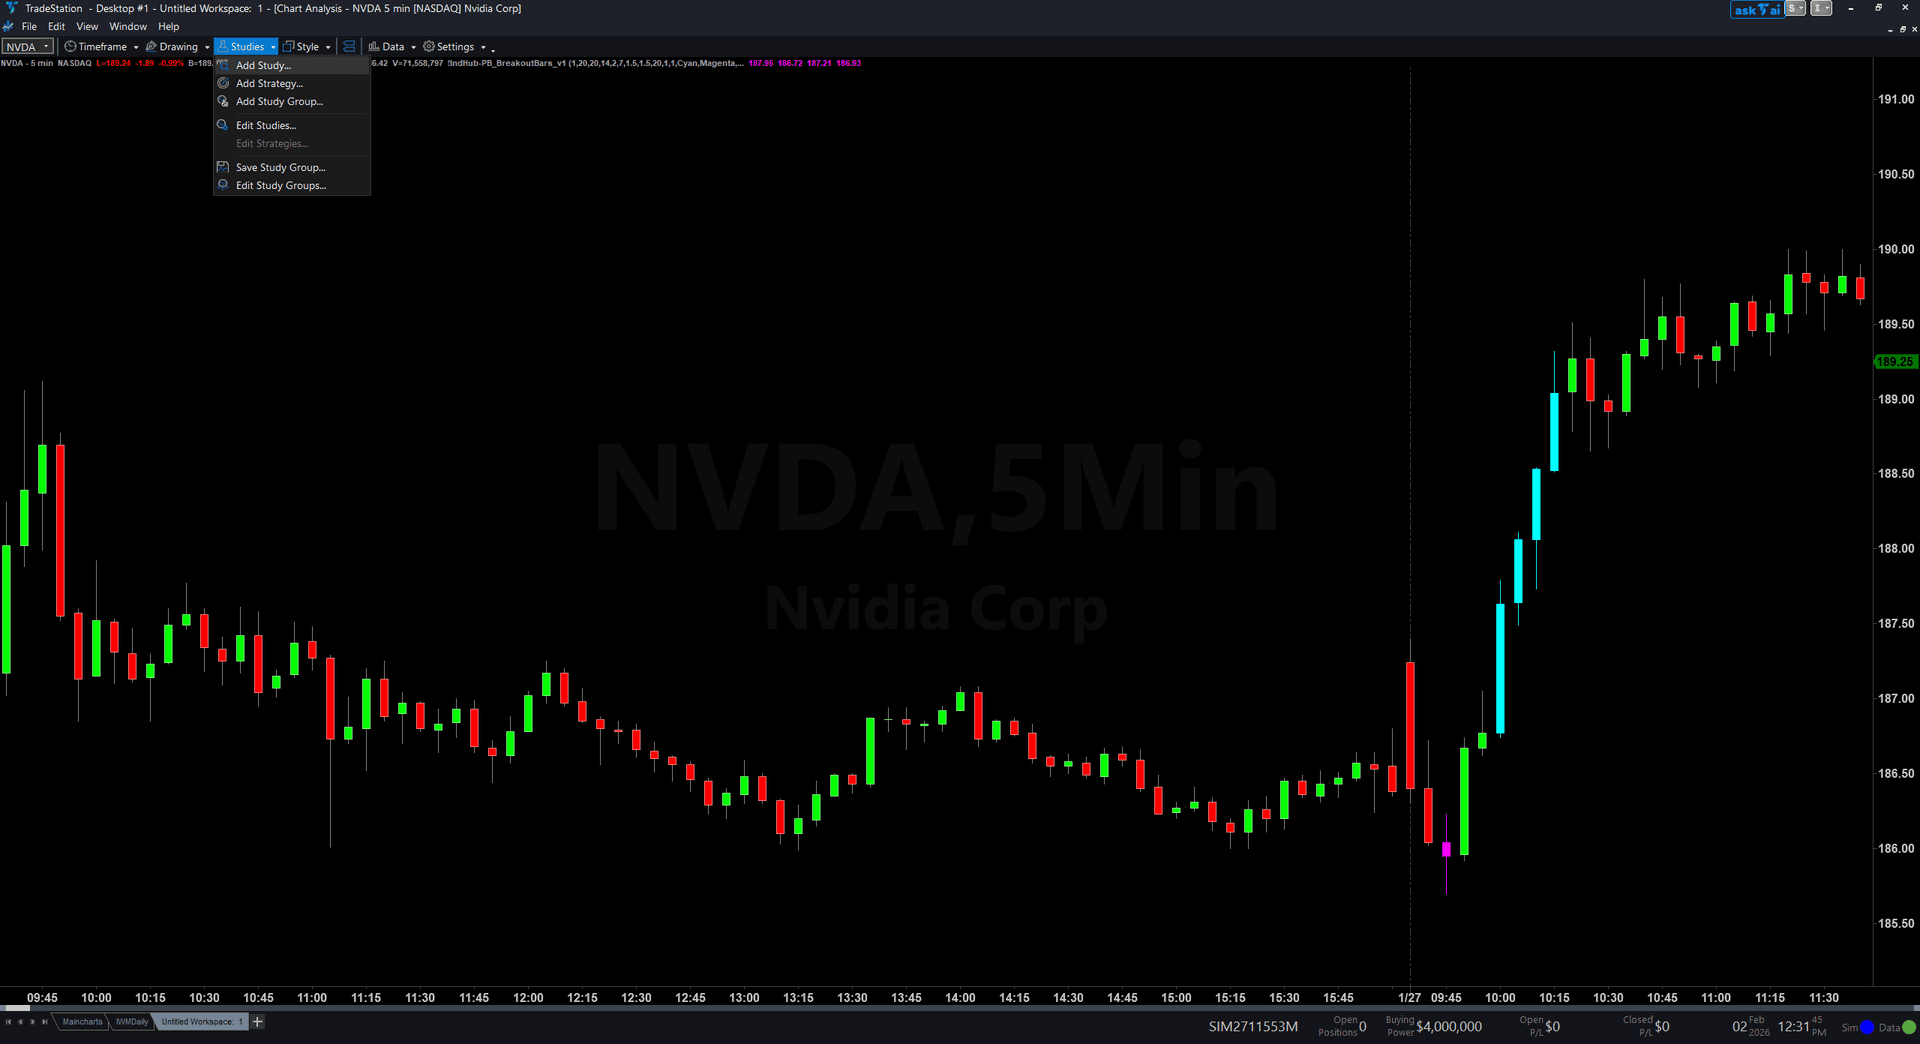
Step 6: Open the Studies menu
On your chart, click the Studies dropdown in the toolbar and select Add Study.
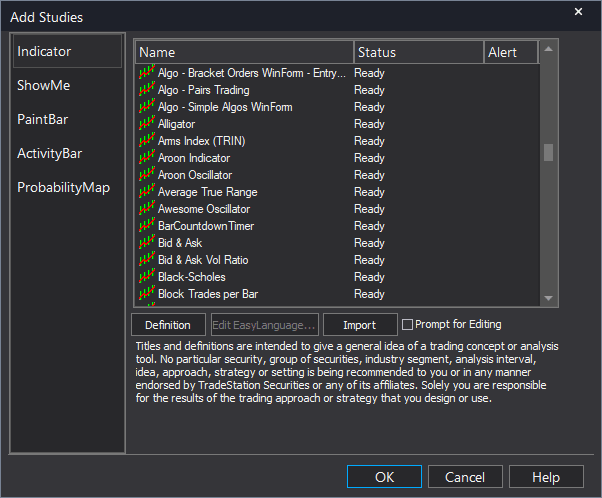
Step 7: Select the ShowMe study
In the Add Studies dialog, click the ShowMe tab on the left side. Find "IIndHub-AutoTrendLineShowme" in the list, select it, and click OK to apply.
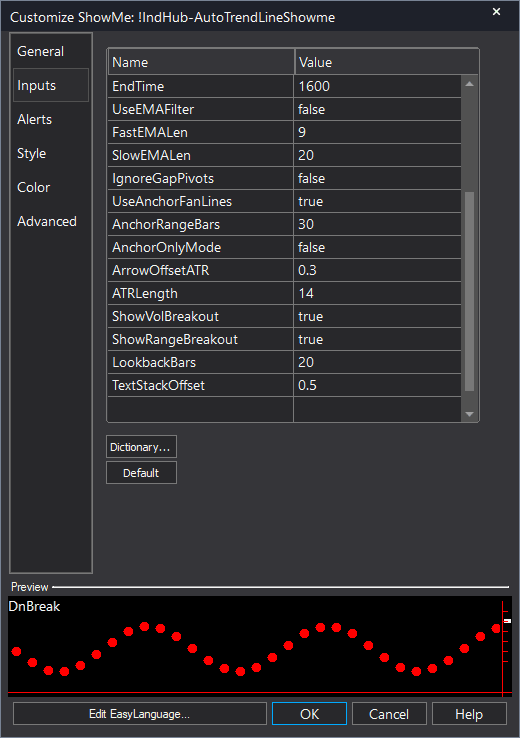
Step 8: Configure settings (optional)
Right-click anywhere on the chart, go to Studies > Edit Studies..., select the study, and click the Inputs tab. Key inputs: ShowVolBreakout (default true, shows volume % at break bars), ShowRangeBreakout (default true, shows range %), LookbackBars (default 20), ArrowOffsetATR (default 0.3), TextStackOffset (default 0.5), AnchorOnlyMode (default false, set true to only show breaks of major trend lines).
Common Issues
The volume and range text is not showing on my chart, only the dots appear.
Make sure ShowVolBreakout and ShowRangeBreakout are both set to true in the indicator inputs. If they are already true, check that your chart zoom level shows enough detail — the text labels may be too small to read when zoomed out. Try zooming into a smaller bar range to see the annotations clearly.
Some break dots show negative volume percentages. What does that mean?
A negative volume percentage means the break bar had less volume than the average over the LookbackBars period. Low-volume breaks are weaker and more likely to reverse. Focus on breaks where volume percentage is positive and ideally above +50%, indicating the break has participation from larger market participants.
Can I use the ShowMe without the main chart indicator?
Yes. The ShowMe study calculates its own trend lines internally and works independently. However, using it alongside the Auto Trend Lines chart indicator gives you the full picture: the chart indicator shows the trend lines visually, and the ShowMe marks the exact break points with data.
For additional help, contact support.