Unified SMC Chart Indicator
The chart indicator renders all five SMC modules directly on your price chart using drawing objects — trend lines for structure, colored zones for order blocks and FVGs, labeled signals for BOS, MSS, and liquidity sweeps, and premium/discount zone boundaries. Five diagnostic plots are also output for programmatic use in strategies or other indicators.
30-Day Money-Back Guarantee
Try it risk-free. Not satisfied? Full refund, no questions asked.
Part of the Unified SMC Trading System
Get all 3 study types for $297 — save $-212
Who This Is For
Apply to any chart timeframe. Best on 5-minute to daily charts for liquid markets (futures, stocks, forex, crypto). The indicator automatically detects and labels all institutional signals as they form.
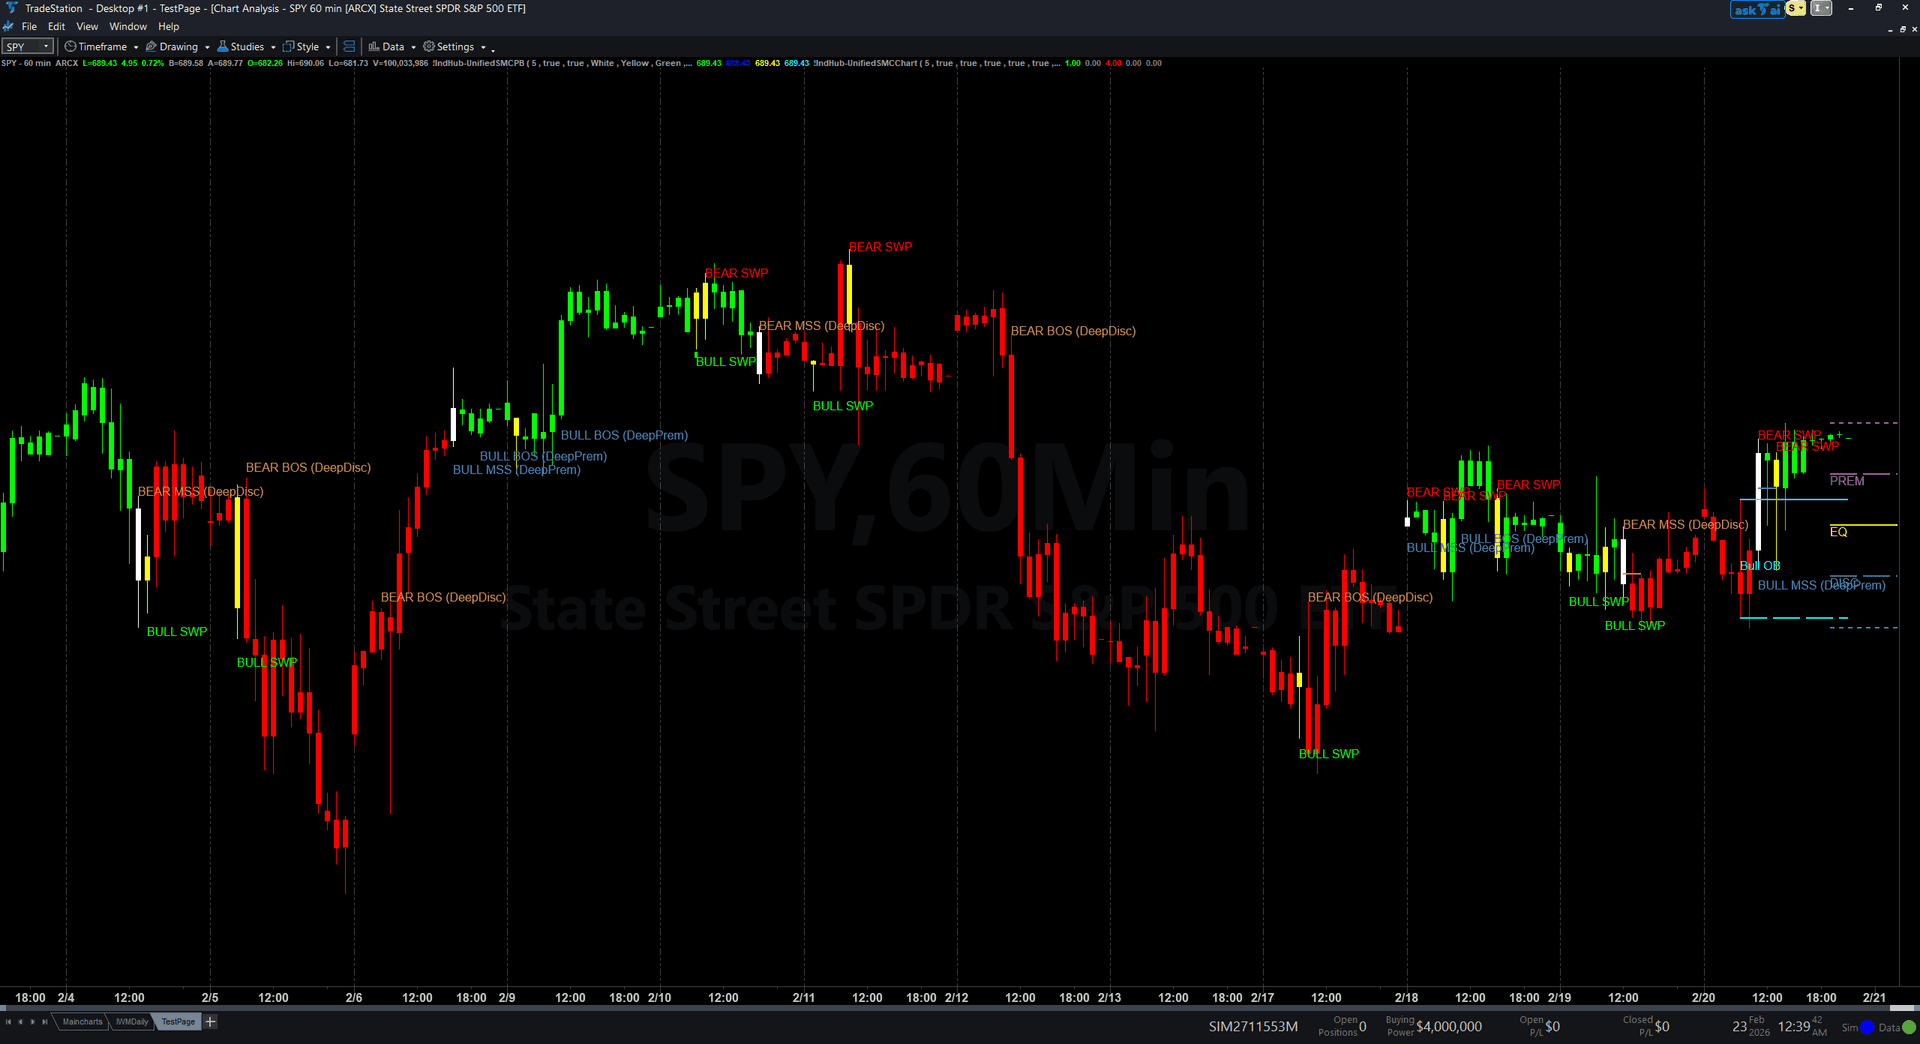
See It in Action
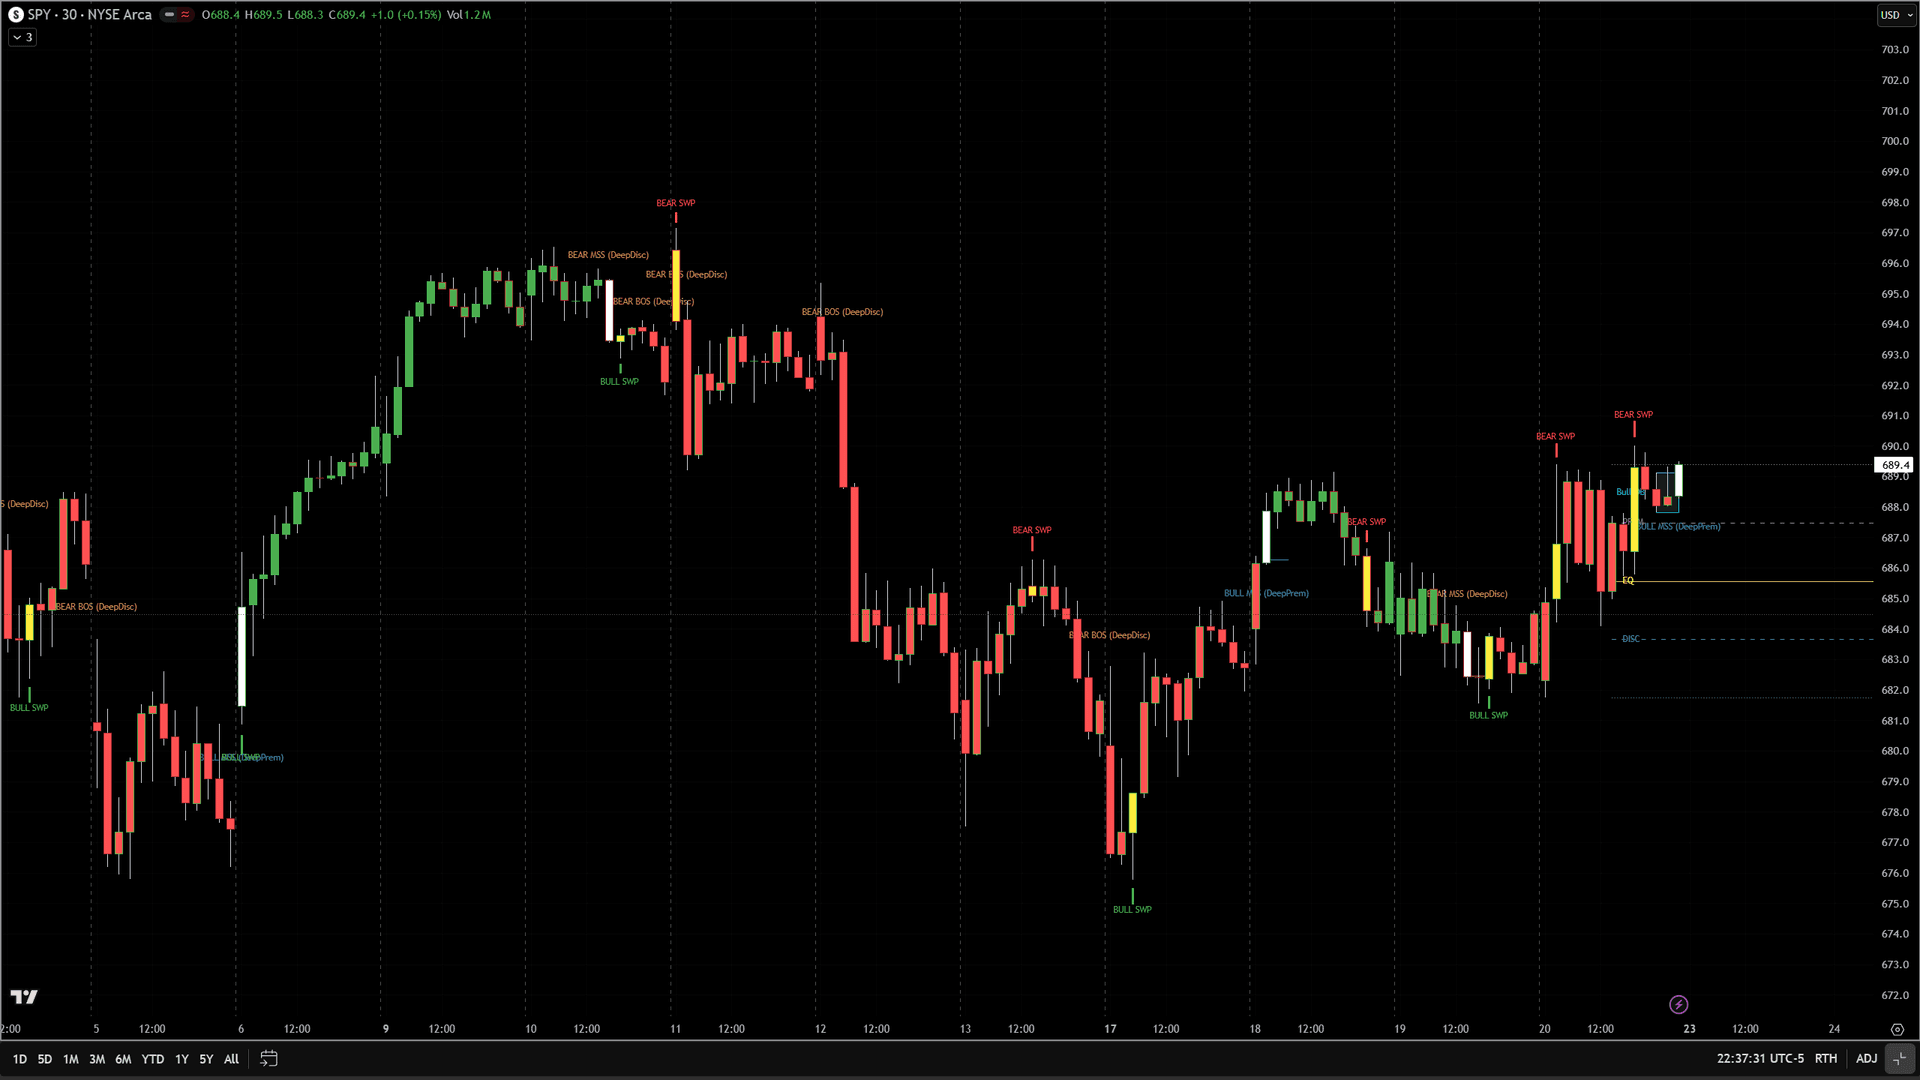
Example chart showing Unified SMC Chart Indicator on a live trading session
Example chart showing Unified SMC Chart Indicator on a live trading session
Installation Guide
Step 1: Download the indicator file
After purchasing, download the unified-smc-bundle.eld file from your confirmation email or downloads page.
Step 2: Open the Import Wizard
In TradeStation, click File > Import/Export EasyLanguage to launch the Import/Export Wizard.
Step 3: Import the ELD file
Select 'Import EasyLanguage file (ELD, ELS or ELA)', browse to your downloaded file, and click Next to import all three studies.
Step 4: Add to your chart
On your chart, click Studies > Add Study. Find 'IIndHub-UnifiedSMCChart' in the indicator list and click OK.
Step 5: Add the PaintBar
In the same Add Studies dialog, switch to the PaintBar tab. Find 'IIndHub-UnifiedSMCPB' and click OK.
Step 6: Add RadarScreen (optional)
Open a RadarScreen window, click Studies > Add Study, and add 'IIndHub-UnifiedSMCRadar' to scan your watchlist.
Common Issues
The chart looks cluttered with too many labels. How do I reduce the noise?
Increase the SwingStrength input to detect only the most significant pivots. Default is 5. Try 7-10 for higher timeframes. You can also toggle individual modules on/off (e.g., disable FVG zones if you only want structure labels).
Signals are not appearing on my chart.
Make sure you have enough historical bars loaded. The indicator needs at least 200 bars of data. Also verify the chart timeframe — very high timeframes (weekly/monthly) with low SwingStrength may produce very few signals.
For additional help, contact support.